


Section 2: General operation
Model 2461 Interactive SourceMeter® Instrument Reference Manual
2-134
2461-901-01 A/November 2015
Using the Graph tab
You can touch the plot on the Graph tab to zoom in or out on data, display specific data points, or
change which area of the graph you are looking at.
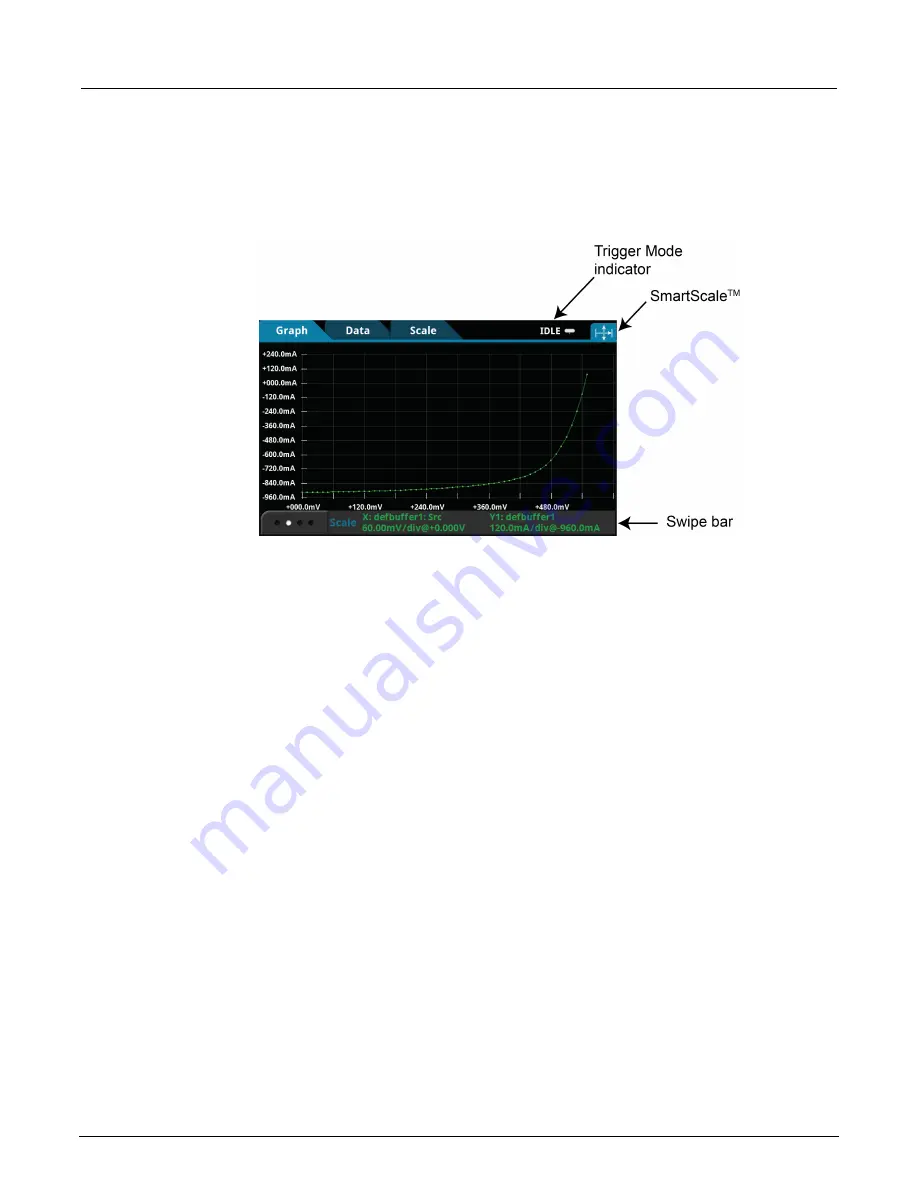
Figure 78: Graph tab
To zoom in on data, use two fingers and flick out. To zoom back out, pinch in. To view earlier data,
swipe to the left.
When you manually adjust the scaling of the data, automatic scaling is turned off. To return to
automatic scaling, select SmartScale
TM
in the upper right corner of the Graph tab. When SmartScale
is on, the instrument keeps the latest data displayed and determines the best way to scale data
based on the data and the instrument configuration (such as the measure count).
To view the values at a specific data point, zoom into a scale where the data point is visible and touch
the data point. The Data Point dialog box is displayed with the X and Y values of that point.
If you have the measure count set to more than 1, the graph tracks data as a group. The group
indicator (shown in the figure above) shows the start of the group.
The timestamp on the X-axis shows the timestamps. As the values of the timestamps become large,
the first part of the timestamp is displayed to the left in orange and subsequent digits are displayed on
the axis, prefaced by two orange dots (
..
).
If the Y-axis displays a ?, there are multiple units in the reading buffer. Clear the buffer to clear the
inconsistent units.
You can initiate a trigger model from the Graph screen:
1. Select the
Trigger Mode
indicator in the indicator bar.
2. Select
Initiate Trigger Model
from the menu.
You can also press the
TRIGGER
key to initiate a trigger model.