Data Logging
– go to the tab with charts and tables to be printed/exported as a report;
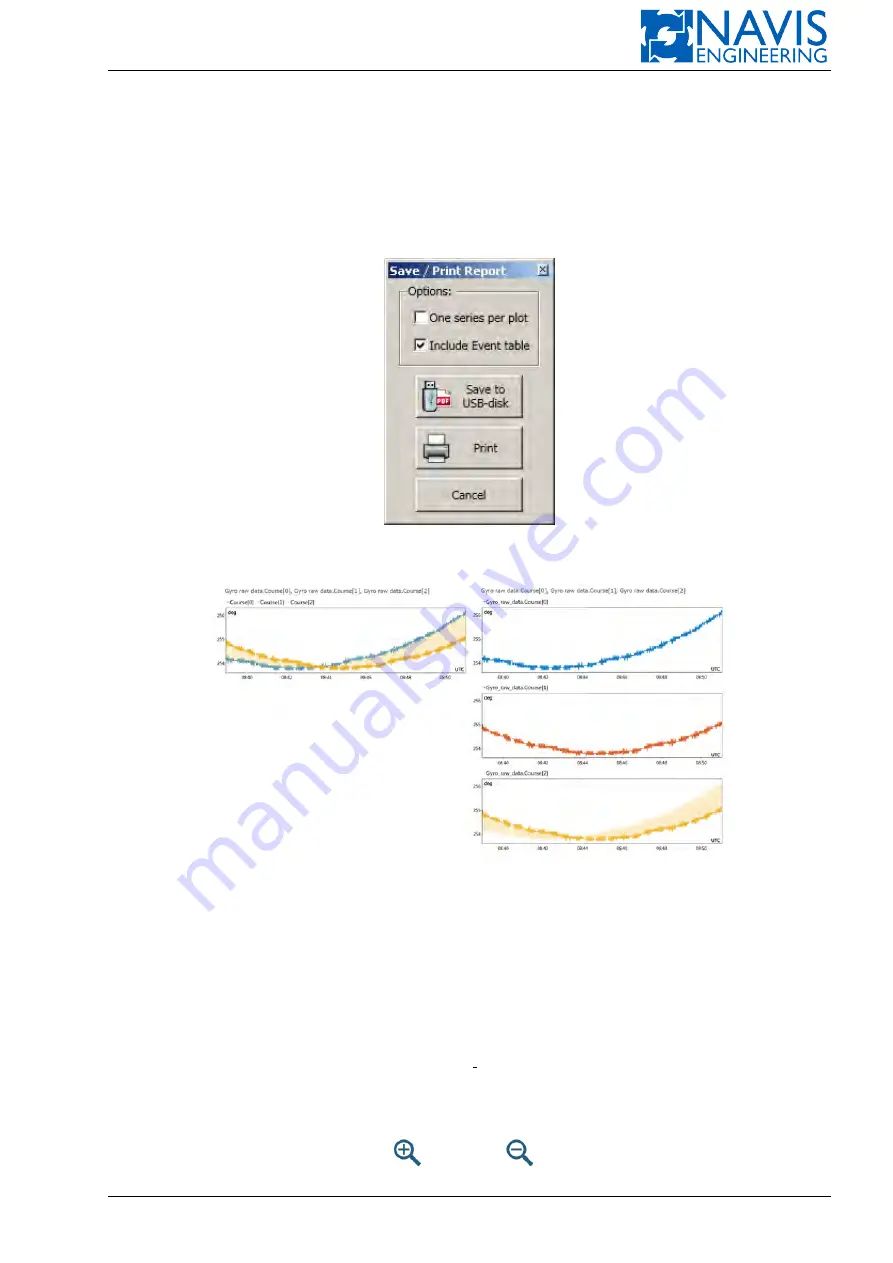
– press the “Save/Print Report” softkey and wait for “Save/Print Report” window will appear (see figure H.17);
– in the opened window tick the following option parameters, if necessary:
One series per plot
— to plot each series on a separate chart (even if the series were grouped on the same
chart).
Report example is shown on figure H.18;
Include Event table
— to add the Event table.
Figure H.17: Save/Print Report Window
Figure H.18: Report examples. 1: Standard report. 2: Report with “One series per plot” option
4.1. To export report to the USB flash drive:
– Insert USB flash drive into DLS computer USB port.
– Press “Save to USB-disk” item.
If USB flash drive is connected incorrectly / not connected, “No mounted flash drive found, insert flash
drive and try export again” message will appear.
– Wait for “Report has been saved at
<
path
>
” message will appear.
This operation may take up to several minutes.
– Your USB flash drive contains folder “Navis Reports”.
4.2. Press “Print” item to print report. Chosen set of charts and tables will be printed.
Service
softkeys located at the bottom side of the screen are used for (see figure H.19):
– chart zooming along the time axis:
— zoom in,
— zoom out;
Doc. 000.JDP-10000-OME, rev.3.3.13/“2102.$–17A-Advanced”
334
Содержание NavDP 4000 Series
Страница 88: ...NAVIS NavDP 4000 Operation Manual Figure 5 35 Dark Theme 87 Doc 000 JDP 10000 OME rev 3 3 13 2102 17A Advanced...
Страница 222: ...NAVIS NavDP 4000 Operation Manual Figure 10 74 Drift Plot Window 221 Doc 000 JDP 10000 OME rev 3 3 13 2102 17A Advanced...
Страница 324: ...NAVIS NavDP 4000 Operation Manual Figure H 4 Remote DLS Mode 323 Doc 000 JDP 10000 OME rev 3 3 13 2102 17A Advanced...


