NAVIS NavDP 4000. Operation Manual
The consequence indicator (5):
light grey
— all components included in the analysis are not active (there are no red or green indicators and at least one
indicator is light-grey);
dark grey
— there is no failure included in the analysis (all indicators are dark-grey);
green
— at least one active component is included in the analysis (at least one indicator is green and there are no red
indicators);
red
— there is at least one critical failure of component, included in the analysis (at least one indicator is red).
The indicator of the component state in the Consequence analysis (6):
light grey
— the failure is included in the analysis but the component is not active;
dark grey
— the failure is excluded from the analysis;
green
— the failure is included in the analysis and the component is active;
red
— a critical failure of the component (the failure is included in the analysis). The critical failure is the failure after
which the thrusters are not able to produce sufficient thrust and/or power components — sufficient amount of power
for the vessel’s capability to maintain its position.
The alarm message is generated in this case.
Softkeys
9
and
10 softkeys
are used to go through the list.
On/Off (11) softkey
is for the including to the analysis and excluding from the analysis the selected failure.
CAP Plot (12) softkey
opens the Capability plot window and activates the capability analysis function in the Hypothetic
mode.
Drift Plot (13) softkey
opens the Drift plot window and activates the drift analysis function.
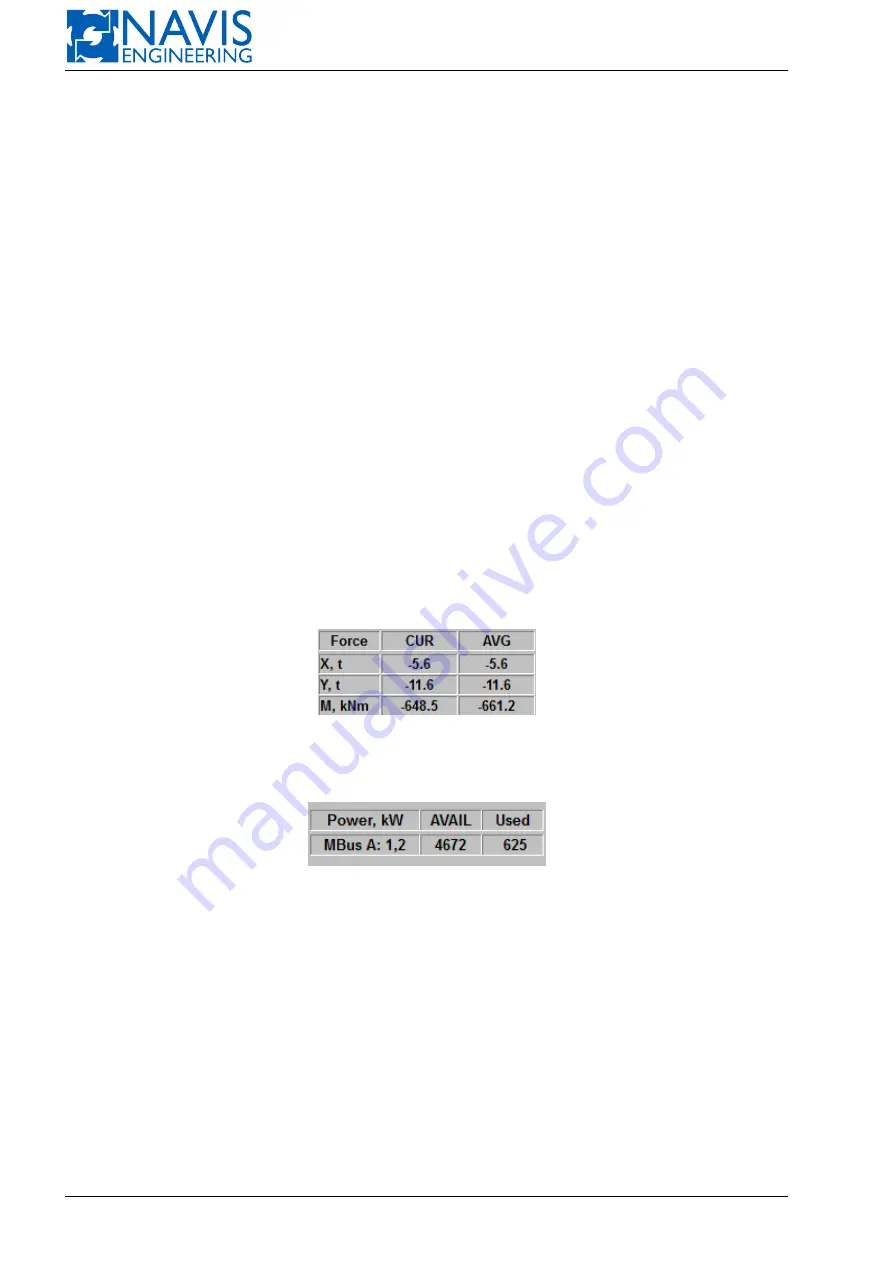
The table on Figure 10.89 contains the current and average values of the thruster forces.
Figure 10.89: The forces indicator
The table on Figure 10.90 contains available and used power values on the buses.
Figure 10.90: The power indicator
In case of two or more buses are off, they considered as separate ones, as well as the used power value is displayed.
10.11
CPU Temperature Monitoring
NAVIS NavDP 4000
provides two-level temperature monitoring:
Two sensors are installed in the system:
– CPU temperature sensor;
– System temperature sensor.
To view the present CPU and System temperatures select
Services
item
⇒
Info
on the Starter screen (see Figure
For each sensor the alarms of two categories are generated:
231
Doc. 000.JDP-10000-OME, rev.3.3.13/“2102.$–17A-Advanced”
Содержание NavDP 4000 Series
Страница 88: ...NAVIS NavDP 4000 Operation Manual Figure 5 35 Dark Theme 87 Doc 000 JDP 10000 OME rev 3 3 13 2102 17A Advanced...
Страница 222: ...NAVIS NavDP 4000 Operation Manual Figure 10 74 Drift Plot Window 221 Doc 000 JDP 10000 OME rev 3 3 13 2102 17A Advanced...
Страница 324: ...NAVIS NavDP 4000 Operation Manual Figure H 4 Remote DLS Mode 323 Doc 000 JDP 10000 OME rev 3 3 13 2102 17A Advanced...


