The waveforms for the other available spectrum types are computed as follows:
Phase: angle = arctan (
I
n
/R
n
)
_M
n
> M
min
_angle = 0_
M
n
M
min
Where
M
min
is the minimum magnitude, fixed at about 0.001 of the full scale at any gain setting,
below which the angle is not well defined.
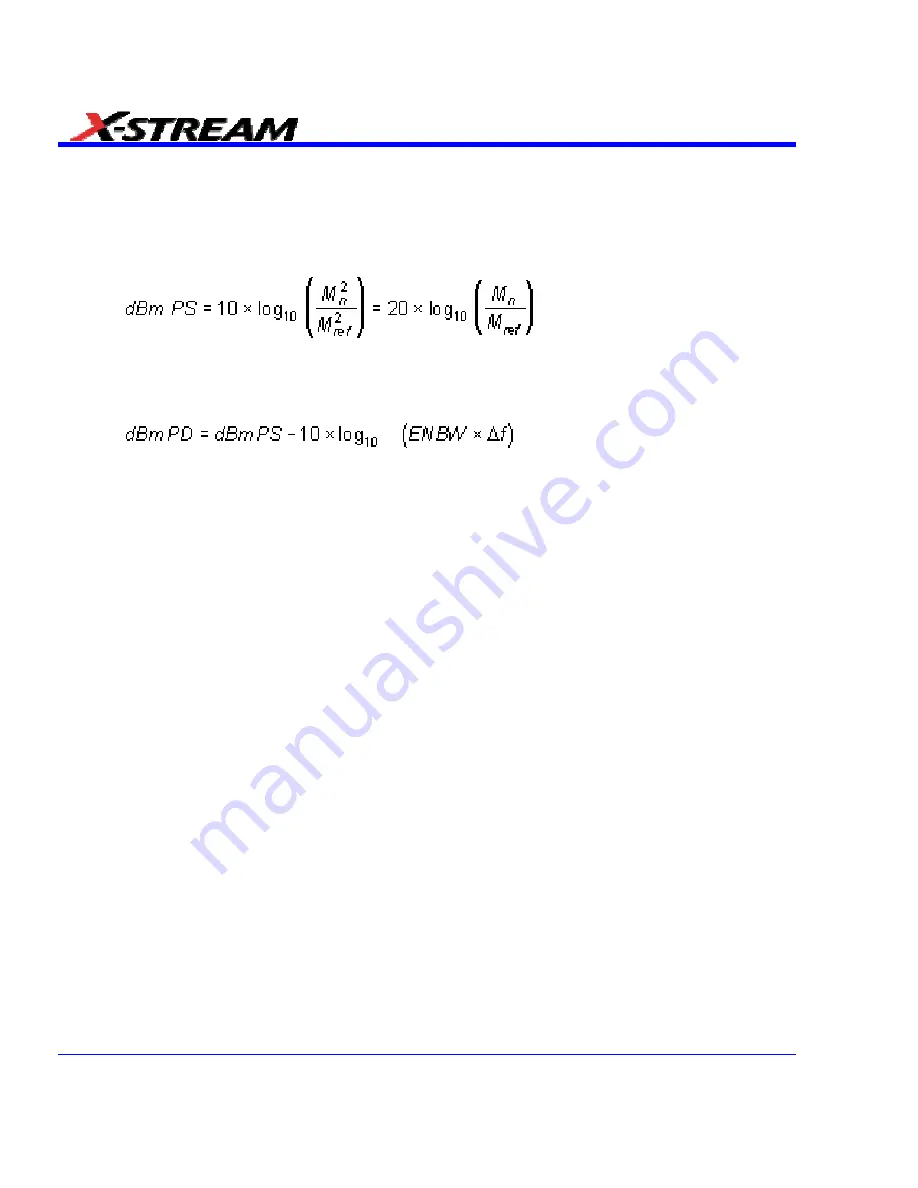
The dBm Power Spectrum:
where
M
ref
= 0.316 V (that is, 0 dBm is defined as a sine wave of 0.316 V peak or 0.224 V rms,
giving 1.0 mW into 50
Ω
).
The dBm Power Spectrum is the same as dBm Magnitude, as suggested in the above formula.
dBm Power Density:
where
ENBW
is the equivalent noise bandwidth of the filter corresponding to the selected
window, and
Delta f
is the current frequency resolution (bin width).
The FFT Power Average takes the complex frequency-domain data
R'
n
and
I'
n
for each
spectrum generated in Step 5, and computes the square of the magnitude:
M
n
2
= R'
n
2
+ I'
n
2
,
Then sums
M
n
2
and counts the accumulated spectra. The total is normalized by the number
of spectra and converted to the selected result type using the same formulas as are used
for the Fourier Transform.
Glossary
This section defines the terms frequently used in FFT spectrum analysis and relates them to the
oscilloscope.
•
Aliasing -
If the input signal to a sampling acquisition system contains components whose
frequency is greater than the Nyquist frequency (half the sampling frequency), there will be
less than two samples per signal period. The result is that the contribution of these
components to the sampled waveform is indistinguishable from that of components below the
Nyquist frequency. This is
aliasing
.
The timebase and transform size should be selected so that the resulting Nyquist frequency
is higher than the highest significant component in the time-domain record.
•
Coherent Gain -
The normalized coherent gain of a filter corresponding to each window
function is 1.0 (0 dB) for a rectangular window and less than 1.0 for other windows. It defines
the loss of signal energy due to the multiplication by the window function. This loss is
compensated for in the oscilloscope. The following table lists the values for the implemented
windows.
200
SDA-OM-E Rev H
Содержание SDA
Страница 1: ...SERIAL DATA ANALYZER OPERATOR S MANUAL December 2007 ...
Страница 148: ...Standard Horizontal Parameter Help Markers Standard Vertical Parameter Help Markers 148 SDA OM E Rev H ...
Страница 223: ...SDA Operator s Manual Example 6 SDA OM E Rev H 223 ...
Страница 225: ...SDA Operator s Manual SDA OM E Rev H 225 ...
Страница 232: ...In this figure the panel has been pasted onto the Excel sheet for comparison 232 SDA OM E Rev H ...
Страница 243: ...SDA Operator s Manual This example used the CORREL Array1 Array2 function of Excel as depicted below SDA OM E Rev H 243 ...
Страница 246: ...246 SDA OM E Rev H ...
Страница 247: ...SDA Operator s Manual Excel Example 5 Using a Surface Plot SDA OM E Rev H 247 ...
Страница 279: ...SDA Operator s Manual Convolving two signals SDA OM E Rev H 279 ...
Страница 310: ...The jitter wizard is accessed from the Analysis drop down menu 310 SDA OM E Rev H ...
Страница 327: ...SDA Operator s Manual SDA OM E Rev H 327 ...
Страница 328: ...328 SDA OM E Rev H ...
Страница 394: ...394 SDA OM E Rev H ...
Страница 395: ...SDA Operator s Manual SDA OM E Rev H 395 ...


