


2 Functions
44
7ST6 Manual
E50417-G1176-C251-A3
2.1.6
Oscillographic Fault Records
2.1.6.1
Functional Description
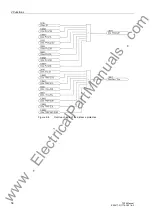
The 7ST6 numerical overhead contact line protection is equipped with a fault record-
ing function.
The instantaneous values of the measurement quantities i (overhead contact line cur-
rent) and u (overhead contact line voltage) are recorded in all variants of the 7ST6
device.
In devices with 3 measuring inputs (3xI, 3xU), the instantaneous value of the measure-
ment quantity i
X
(defrosting current) is recorded as well.
In protection devices with the maximum scope of functions, the following instanta-
neous values are additionally recorded:
i
F-
Current of the negative feeder
u
F-
Voltage of the negative feeder
u
Ref
Busbar reference voltage
i1+i2
Summation current from I1 and I2
Furthermore, the following r.m.s. values of the defrosting protection are recorded:
id>
Differential current
ir
Restraint current
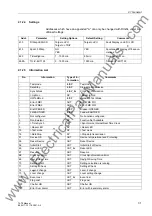
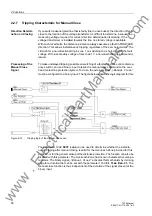
The 7ST6 works with an automatic frequency correction, i.e. the sampling interval is
automatically adapted to frequency changes. The table below shows the sampling
rates and sampling intervals for the individual rated frequencies:
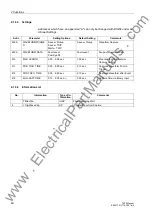
Table 2-1
Sampling rates and sampling intervals of the available rated frequencies
For a fault, the data are stored for an adjustable period of time, but no more than 5
seconds per fault. A total of 8 records can be saved within 15 s. The fault record
memory is automatically updated with every new fault, so no acknowledgment for pre-
viously recorded faults is required. The storage of fault values can be started by pickup
of a protection function, as well as via binary input and via the serial interface.
The data can be retrieved via the serial interfaces by means of a personal computer
and evaluated with the protection data processing program DIGSI
®
and the graphic
analysis software SIGRA 4. The latter graphically represents the data recorded during
the system fault and calculates additional information such as the impedance or r.m.s.
values from the measured values. A selection may be made as to whether the currents
and voltages are represented as primary or secondary values. Binary signal traces
(marks) of particular events, e.g. „fault detection“, „tripping“ are also represented.
If the device has a serial system interface, the fault recording data can be passed on
to a central device via this interface. The data is evaluated by applicable programs in
Rated frequency
[Hz]
Sampling rate
Sampling interval
[ms]
16.7
48
1.25
25
32
1.25
50
16
1.25
60
16
1.04
www
. ElectricalPartManuals
. com