


Chapter 7 Performance Test
7-40
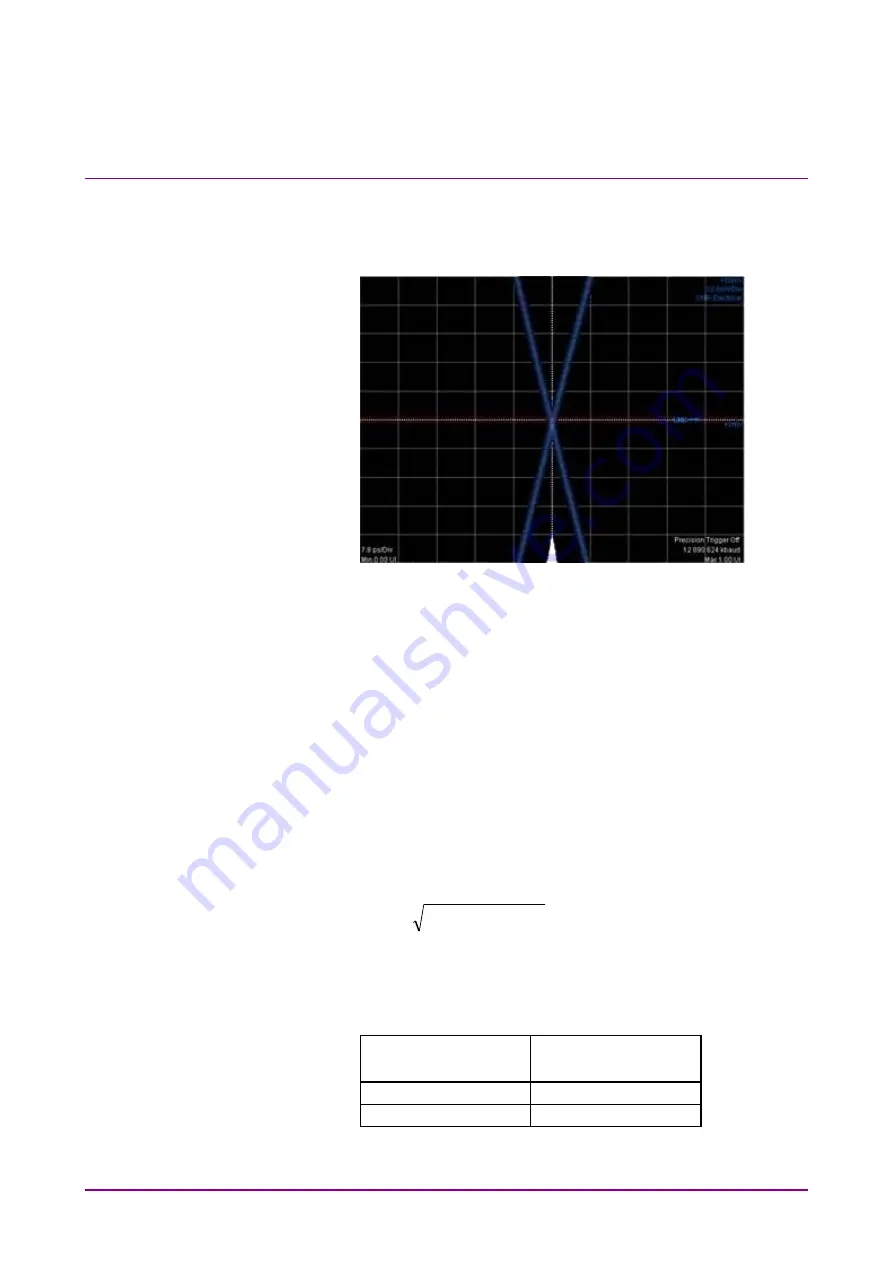
7. Click
Ch A of Scope to display the graph.
8. Adjust Software Delay in Time Scale/Offset tab so that the cross
point is displayed at center of the window.
9. Write down the jitter RMS measurement value. The jitter RMS
measurement value is the std Dev value for Histogram.
10. Connect the
Clk Out
connector and the
CRU In
connector using a
coaxial cable. Refer to Figure 7.3.4-2 (b).
11. Connect the
CRU Out
connector and the
Ch A In
connector using
a coaxial cable. Refer to Figure 7.3.4-2 (b).
12. Click Time CRU of Scope and then click CRU tab.
13. Confirm Lock Status turning to Lock in Green.
14. Adjust Offset in Time -Scale/Offset tab so that the cross point is
displayed at center of the window.
15. Write down the jitter RMS measurement value. The jitter RMS
measurement value is the std Dev value for Histogram.
16. Calculate the added jitter J
Add
using the following formula.
2
2
PPG
CRU
Add
J
J
J
J
CRU
: Measured value in step 15.
J
PPG
: Measured value in step 9.
17. Change PPG1 Bit Rate and Scope Operation Rate to the
following values and repeat the step from 4 to 16.
PPG1 Bit Rate
Scope – CRU
Operation Rate
26 562 500 kbit/s
400GbE/8 (26.5625G)
28 050 000 kbit/s
32GFC (28.05G)
Summary of Contents for BERTWave Series
Page 26: ...VI...
Page 74: ...Chapter 1 Outline 1 48...
Page 166: ...Chapter 4 Screen Operation 4 24...
Page 210: ...Chapter 6 How to Operate Sampling Scope 6 16 Figure 6 2 2 4 Switching Graph Display...
Page 309: ...6 9 Measuring Waveform 6 115 6 How to Operate Sampling Scope Figure 6 9 5 1 Marker Display...
Page 322: ...Chapter 6 How to Operate Sampling Scope 6 128...
Page 380: ...Chapter 8 Maintenance 8 14 7 Click Reinstall Windows 8 Click Yes...
Page 432: ...Appendix A Specifications A 36...
Page 458: ...Appendix D Performance Test Record Form D 12...
Page 466: ...Index Index 6...