


Getting Started
R&S
®
FPL1000
44
User Manual 1178.3370.02 ─ 09
To optimize the display
To optimize the display for the calibration signal, we will adjust the main measurement
settings.
1. Set the center frequency to the calibration frequency:
a) Tap the "Overview" softkey to display the configuration "Overview".
b) Tap the "Frequency" button.
c) In the "Center" field, enter
50
on the number pad on the front panel.
d) Press the "MHz" key next to the number pad.
2. Reduce the span to 20
MHz:
a) In the "Span" field of the "Frequency" dialog box, enter
20
MHz
.
b) Close the "Frequency" dialog box.
3. Average the trace to eliminate noise:
a) In the configuration "Overview", tap the "Analysis" button.
b) In the "Traces" tab, select the trace mode "Average".
c) Enter the "Average Count":
100
.
d) Close the "Analysis" dialog box.
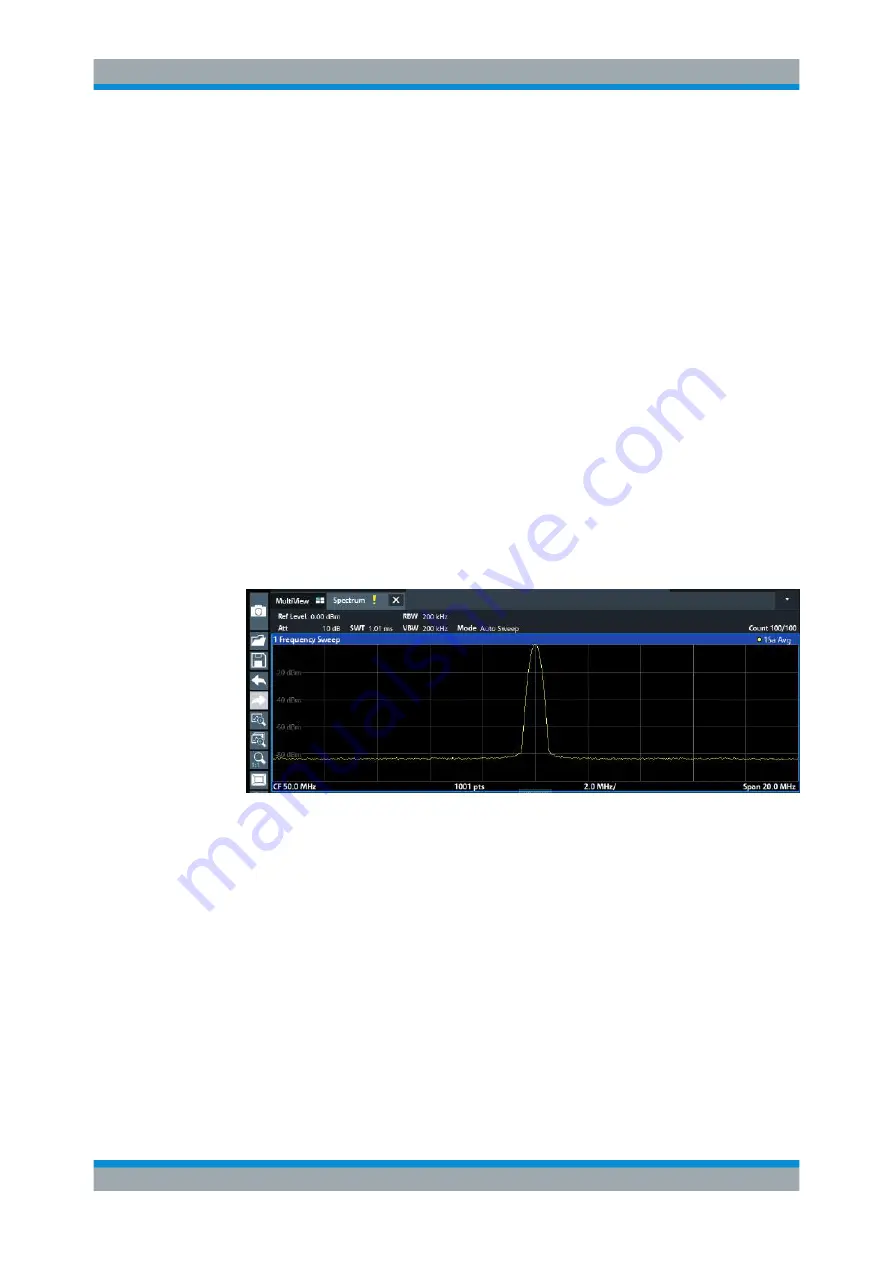
The display of the calibration signal is now improved. The maximum at the center
frequency (=calibration frequency) of 50
MHz becomes visible.
Figure 5-5: Calibration signal with optimized display settings
5.3.2
Displaying a Spectrogram
In addition to the standard "level versus frequency" spectrum display, the
R&S
FPL1000 also provides a spectrogram display of the measured data. A spectro-
gram shows how the spectral density of a signal varies over time. The x-axis shows the
frequency, the y-axis shows the time. A third dimension, the power level, is indicated
by different colors. Thus you can see how the strength of the signal varies over time for
different frequencies.
1. Tap the "Overview" softkey to display the general configuration dialog box.
2. Tap the "Display Config" button.
Trying Out the Instrument


