DOCUCOLOR 12 USER GUIDE
6–9
IMAGE QUALITY
1
2
3
4
5
6
7
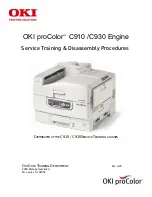
Graphics & Maps
Use the Graphics & Maps option to optimize the
reproduction of detailed graphics, maps, or map-
like originals. Examples include highly technical
drawings, histograms, pie charts, or roadmaps
(Figure 10).
With this option, text on a light-colored
background is enhanced more than if the Photo
option or the Text option were used.
Fine detail and light colors are copied very well in
this mode. Black and white documents with fine
details and a wide range of densities also copy
well in this mode, although the fidelity of the
reproduction would be better if the Photo option
were used.
KEY POINT: When the Graphics & Maps icon is
selected, you should specify the original size of
any document that has dark borders using the
Added Features tab.
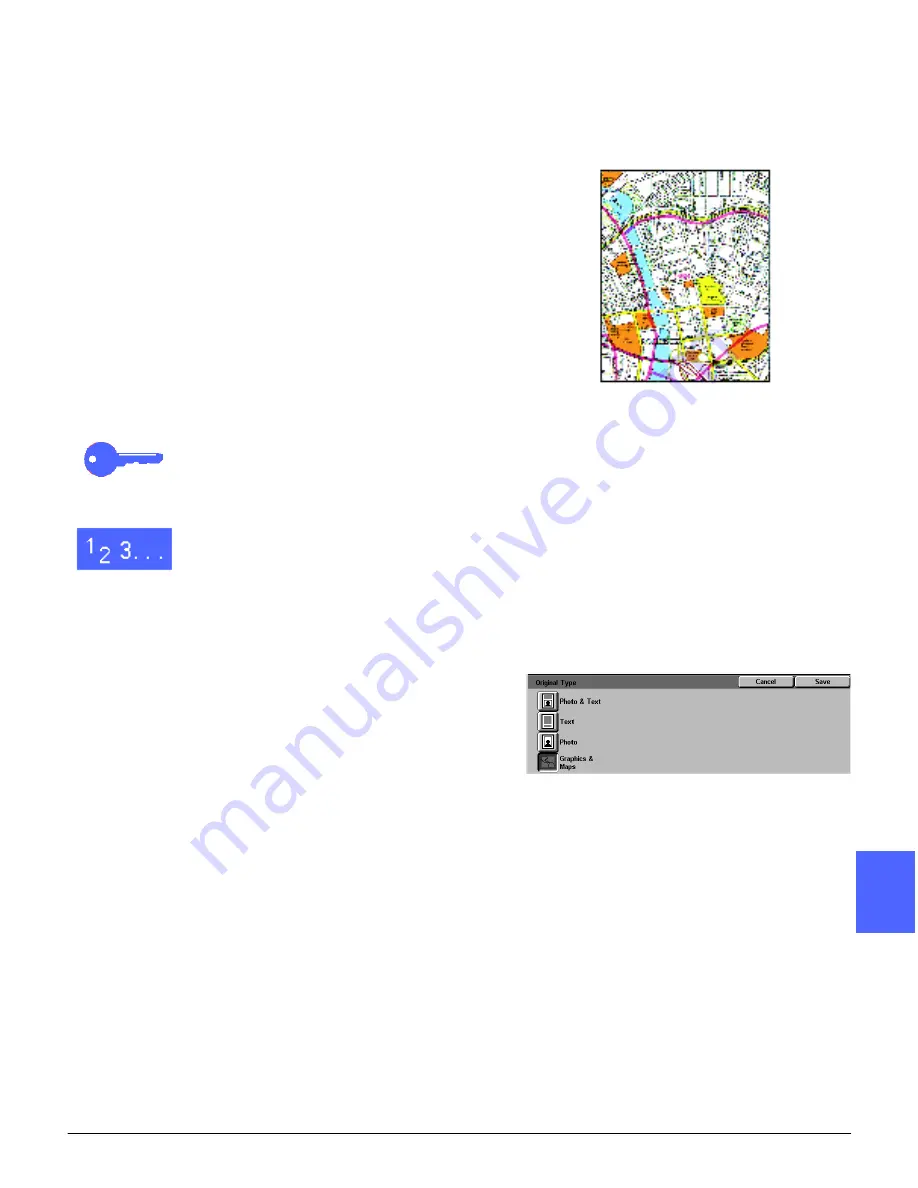
1
Touch the Original Type icon on the Image
Quality tab to display the Original Type screen.
2
Touch the Graphics & Maps icon, as illustrated in
Figure 11.
3
Touch Save to return to the Image Quality tab.
Figure 10: Example of Graphics & Maps
Figure 11: Graphics & Maps icon selected
Summary of Contents for DOCUCOLOR 12
Page 1: ...DOCUCOLOR 12 COPIER PRINTER USER GUIDE ...
Page 26: ...CONTENTS XXVI DOCUCOLOR 12 USER GUIDE 1 2 3 4 5 6 7 ...
Page 130: ...ADDED FEATURES 5 32 DOCUCOLOR 12 USER GUIDE 2 3 4 5 6 7 5 ...
Page 156: ...IMAGE QUALITY 6 26 DOCUCOLOR 12 USER GUIDE 2 3 4 5 6 7 6 ...
Page 186: ...OUTPUT FORMATS 7 30 DOCUCOLOR 12 USER GUIDE 2 3 4 5 6 7 7 ...
Page 192: ...JOB ASSEMBLY 8 6 DOCUCOLOR 12 USER GUIDE 2 3 4 5 6 7 8 ...
Page 230: ...SORTER MAILBOX 11 8 DOCUCOLOR 12 USER GUIDE 2 3 4 5 6 7 11 ...
Page 270: ...PROBLEM SOLVING 13 26 DOCUCOLOR 12 USER GUIDE 2 3 4 5 6 7 13 ...
Page 284: ...TECHNICAL INFORMATION 14 14 DOCUCOLOR 12 USER GUIDE 2 3 4 5 6 7 14 ...
Page 291: ......