Exinda Network Orchestrator
3 Using
|
214
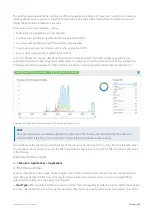
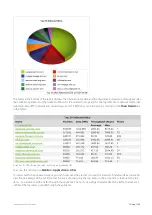
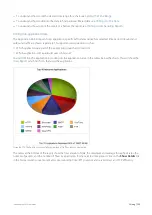
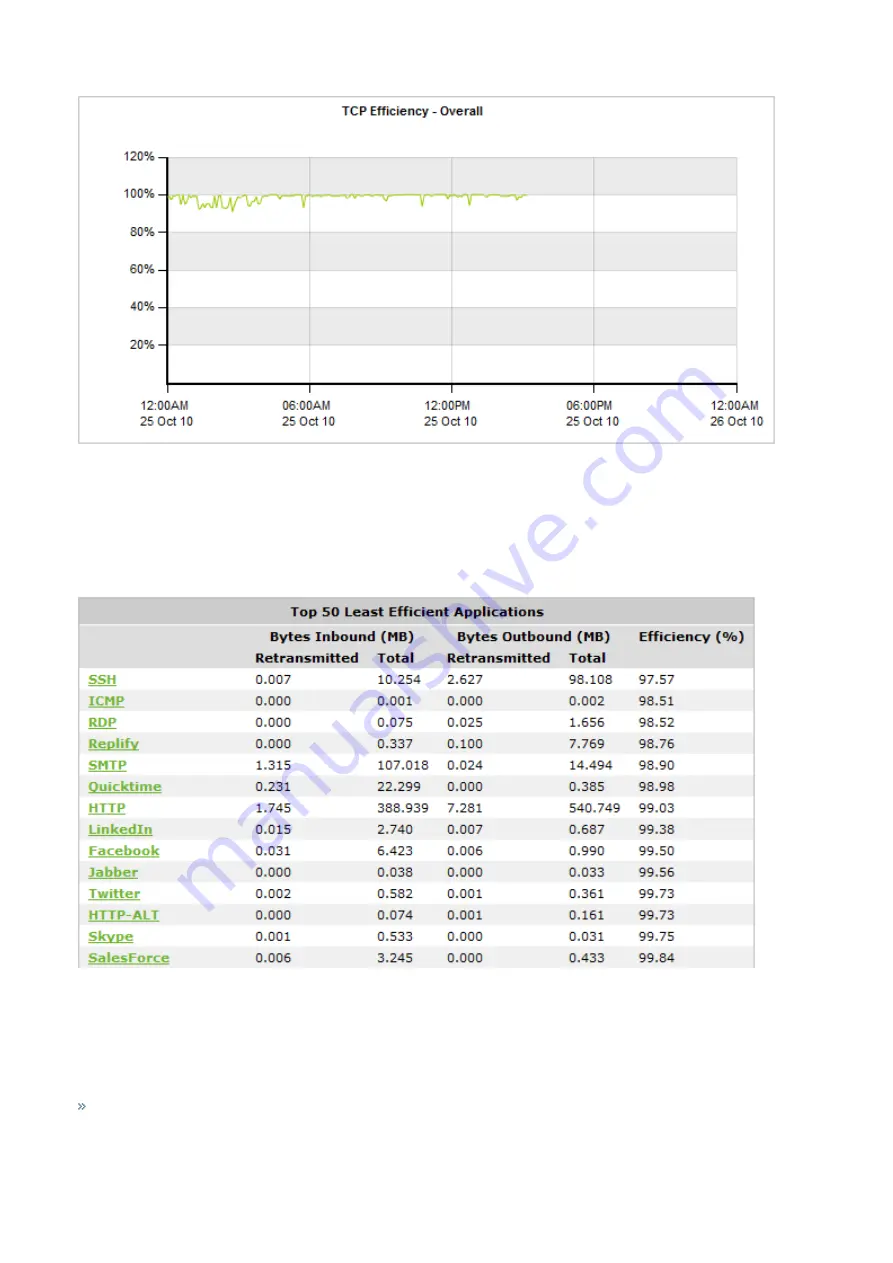
Screenshot 82: The TCP Efficiency report displays TCP connection efficiency over time.
TCP Efficiency is calculated using the formula below:
TCP Efficiency = (Total Bytes - Bytes Retransmitted) / Total Bytes
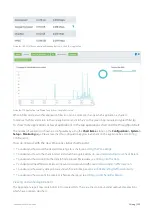
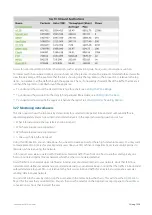
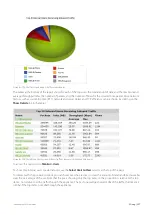
The table below shows both retransmitted bytes and efficiency per Application or Host. Each item in the table below
can be drilled down to view TCP Efficiency details and a graph for that item.
Screenshot 83: The TCP Efficiency report displays the 50 least efficient applications.
Where do I find this report?
Go to
Monitor > Service Levels > TCP Efficiency
.
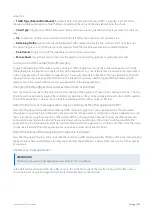
How do I interact with the interactive flash time graphs?
To understand how to get a better look at traffic patterns and to remove clutter on the time graph, see
Summary of Contents for EXNV-10063
Page 369: ...Exinda Network Orchestrator 4 Settings 369 ...
Page 411: ...Exinda Network Orchestrator 4 Settings 411 Screenshot 168 P2P OverflowVirtualCircuit ...
Page 420: ...Exinda Network Orchestrator 4 Settings 420 Screenshot 175 Students OverflowVirtualCircuit ...


