Exinda Network Orchestrator
3 Using
|
201
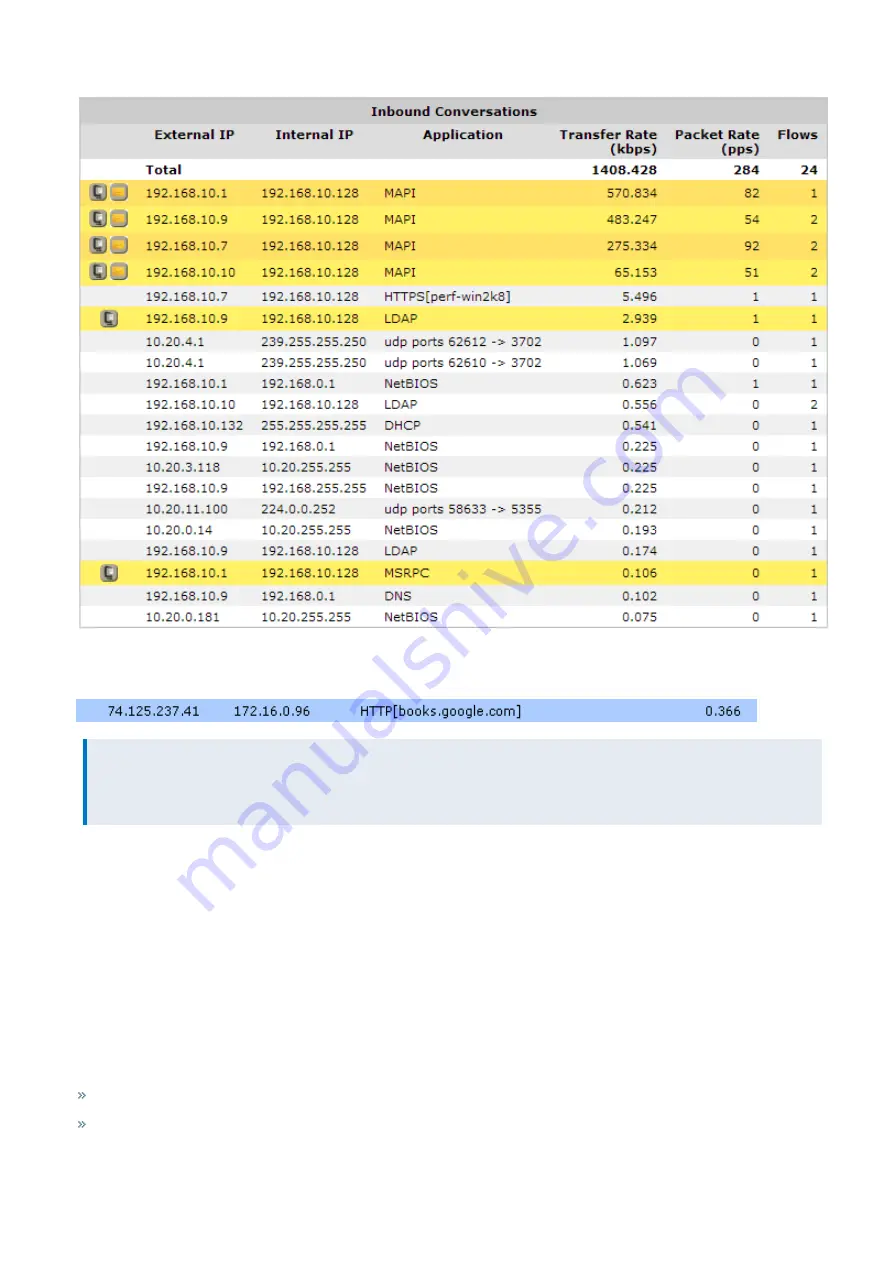
Screenshot 75: The Conversation monitor report displays information about network traffic.
When a conversation has been processed by Edge Cache (see the Edge Cache "How to" guide), it is highlighted in blue.
NOTE
All conversations evaluated by Edge Cache will be highlighted in blue even if the object is set for exclusion from
Edge Cache storage.
To learn more about this monitor, see
.
3.2.3 Monitoring network interfaces
Interface reports allow you to view the volume of traffic flowing in and out of your network. The Throughput report
displays interface and bridge throughput. The Packets Per Second report displays the outbound packet rate from your
network. These reports provide answers to important questions about your network traffic.
Monitoring interface throughput
The Interfaces Throughput report shows throughput for a defined period of time for a particular interface or for all
interfaces aggregated. This report answers questions such as:
Is my link congested?
Which bridge is congested?
Summary of Contents for EXNV-10063
Page 369: ...Exinda Network Orchestrator 4 Settings 369 ...
Page 411: ...Exinda Network Orchestrator 4 Settings 411 Screenshot 168 P2P OverflowVirtualCircuit ...
Page 420: ...Exinda Network Orchestrator 4 Settings 420 Screenshot 175 Students OverflowVirtualCircuit ...

