


Exinda Network Orchestrator
3 Using
|
187
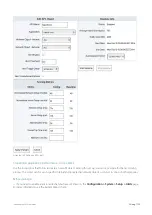
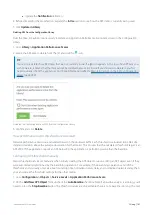
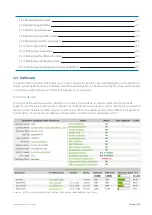
The status of the appliance database is displayed as
Database Status
. The possible statuses include:
Starting
—The database is initializing, and it is waiting for a response from the system on available storage.
Running
—The database is operating.
Upgrading
—The database has started, but is being upgraded.
Downgrading
—The database has started, but is being upgraded.
Stopped
—The database is stopped.
Error
—The database cannot be accessed. This typically appears when there is a problem with the upgrade or down-
grade of the database.
Unknown
—The state of the database is unknown.
Benefits Dashboard
The Benefits Dashboard exposes a set of widgets arranged on a dashboard that shows high level information about your
network traffic. The dashboard answers questions, such as "What are the dominant application groups on my network?
Are recreational apps using a large amount of my bandwidth? Is my link saturated? Am I getting the reduction that I'm
expecting?" The dashboard may also show a recommendation. The Exinda Appliance analyzes network traffic and
makes recommendations based on what it learns.
Widgets can be hidden to customize the dashboard to only include widget(s) relevant to you. To add a hidden widget,
click the '
Add More
' link at the top right of the dashboard. If the '
Add More
' link is not visible, then all available widgets
are displayed. Widget settings and layouts are retained between log-ins.
The dashboard can be captured and converted to PDF by clicking on the PDF icon at the top-right of the interface.
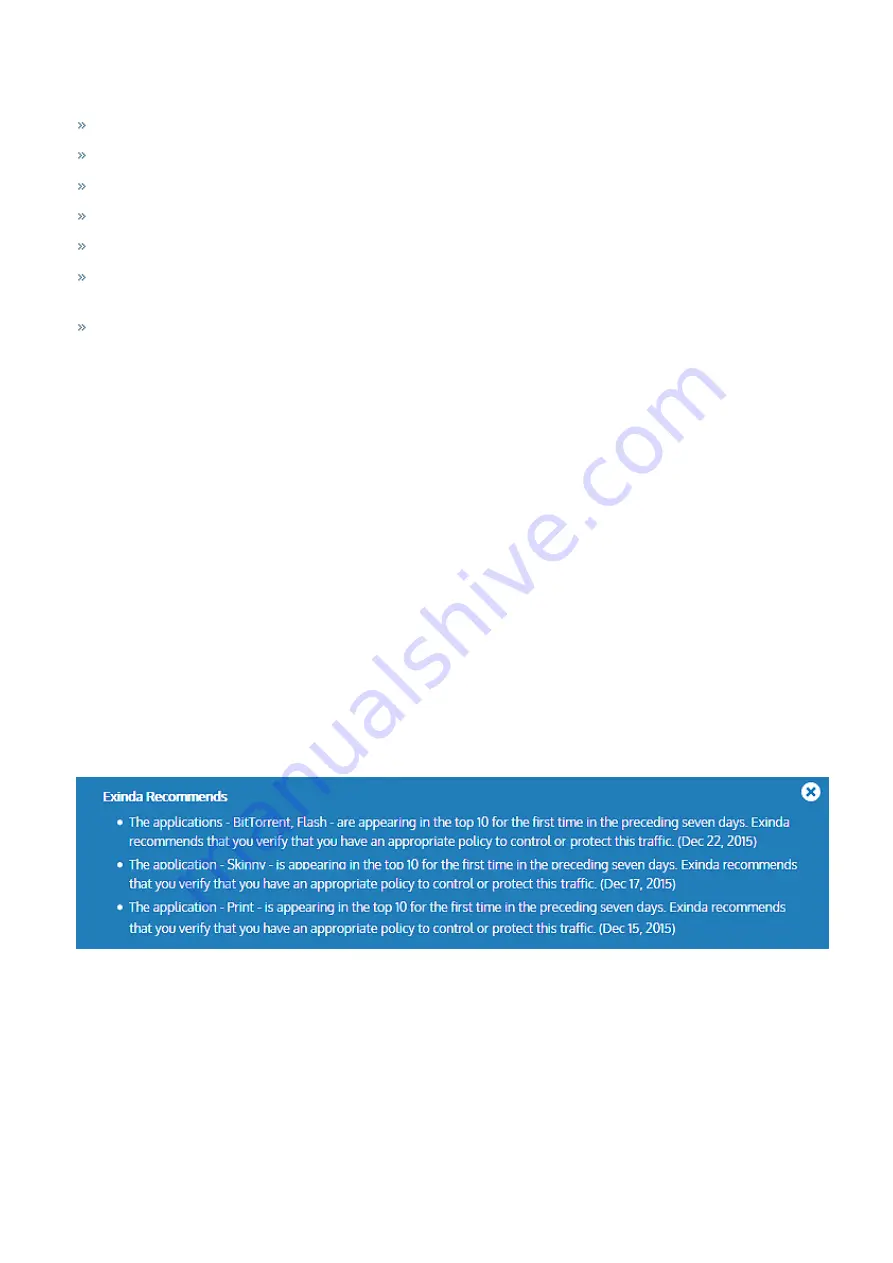
Exinda recommends
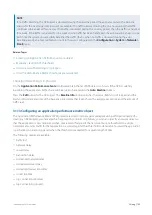
Every night after midnight, your Exinda Appliance analyzes the traffic it saw during the previous day and, if there was
something remarkable or unusual, it makes a recommendation, displays it on the dashboard and sends it to the email
addresses configured in
Network Setup > Email
.
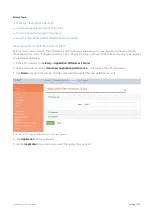
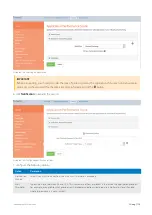
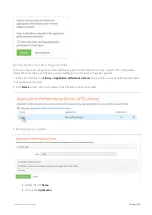
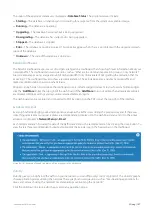
Each recommendation includes the date of the traffic data. Dismiss the recommendation by clicking the close button. To
view the last three recommendations made, double-click the Exinda logo in the header bar on the dashboard.
Screenshot 67: Example of Exinda recommendation messages in the dashboard
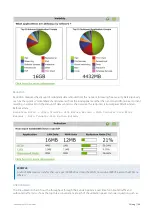
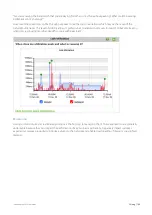
Visibility
Visibility gives you insight into the traffic on your network so you can effectively control or protect it. The visibility graphs
show application groups utilizing the network. These graphs answer questions such as, "Are streaming applications for
music and videos choking the network? Are data backups overrunning the network?"
Click the drill down link to see which apps are in an application group.
Summary of Contents for EXNV-10063
Page 369: ...Exinda Network Orchestrator 4 Settings 369 ...
Page 411: ...Exinda Network Orchestrator 4 Settings 411 Screenshot 168 P2P OverflowVirtualCircuit ...
Page 420: ...Exinda Network Orchestrator 4 Settings 420 Screenshot 175 Students OverflowVirtualCircuit ...


