Exinda Network Orchestrator
3 Using
|
256
How do I interact with the interactive flash time graphs?
To understand how to get a better look at traffic patterns and to remove clutter on the time graph, see
To understand how to set the desired time range for a chart, see
To understand how to print the report or schedule the report, see
Printing and Scheduling Reports
.
Monitoring accelerated connections
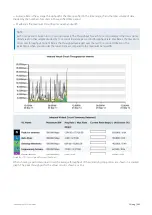
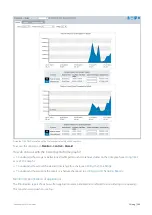
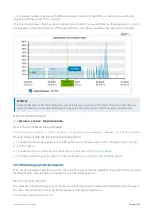
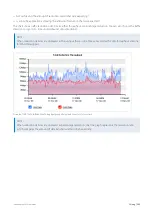
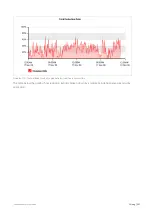
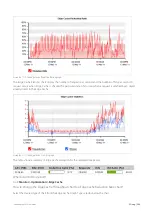
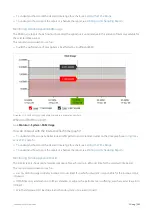
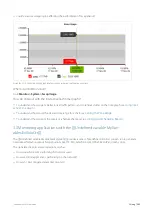
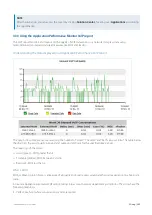
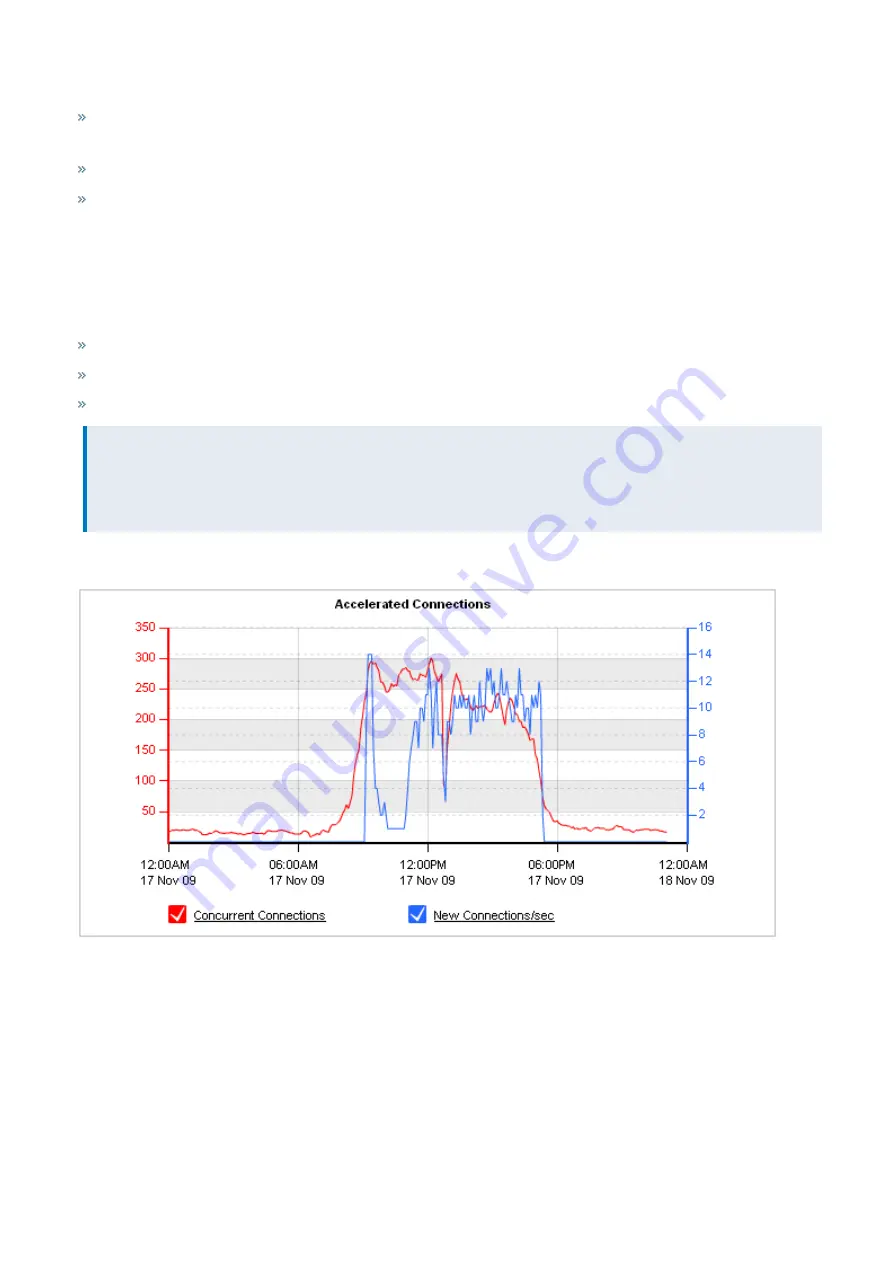
The Accelerated Connections report shows the number of concurrent accelerated connections as well as the
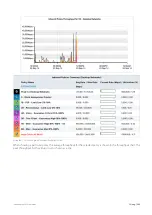
connection establishment rate over time for the selected time period. It also shows the number of connections for each
application acceleration type (SSL, SMB1, SMB2, NCP). This chart can answer questions such as:
Is there an unusual number of accelerated connections or is the connection rate particularly high or low?
Is my traffic being accelerated as I expect?
Am I close to or have I exceeded my licensed maximum number of accelerated connections?”
NOTE
Connections over the licensed limit pass through the appliance without acceleration. If you are concerned about
exceeding your licensed maximum, you can set an alert so that you will be emailed or so that the appliance will send
an SNMP trap when the number of connections exceed your licensed limit.
To find the report, go to
Monitor > System > Accelerated Connections
.
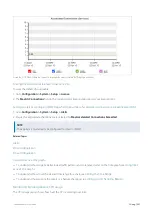
Screenshot 113: The Accelerated Connections graph displays accelerated connections over time.
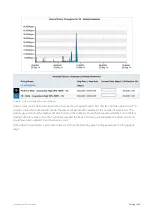
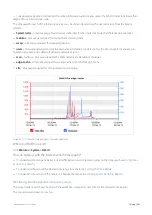
The second chart shows accelerated connections for each type of accelerated traffic: SSL, SMB1, SMB2, and NCP.
Summary of Contents for EXNV-10063
Page 369: ...Exinda Network Orchestrator 4 Settings 369 ...
Page 411: ...Exinda Network Orchestrator 4 Settings 411 Screenshot 168 P2P OverflowVirtualCircuit ...
Page 420: ...Exinda Network Orchestrator 4 Settings 420 Screenshot 175 Students OverflowVirtualCircuit ...


