Exinda Network Orchestrator
3 Using
|
223
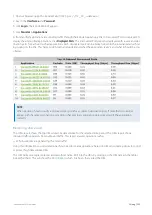
1.
On your browser, open the Exinda Web UI (
https://UI_IP_address
).
2.
Key-in the
User Name
and
Password
.
3.
Click
Login
. The Exinda Web UI appears.
5.
Click
Monitor > Applications
.
6.
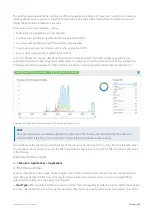
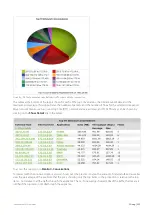
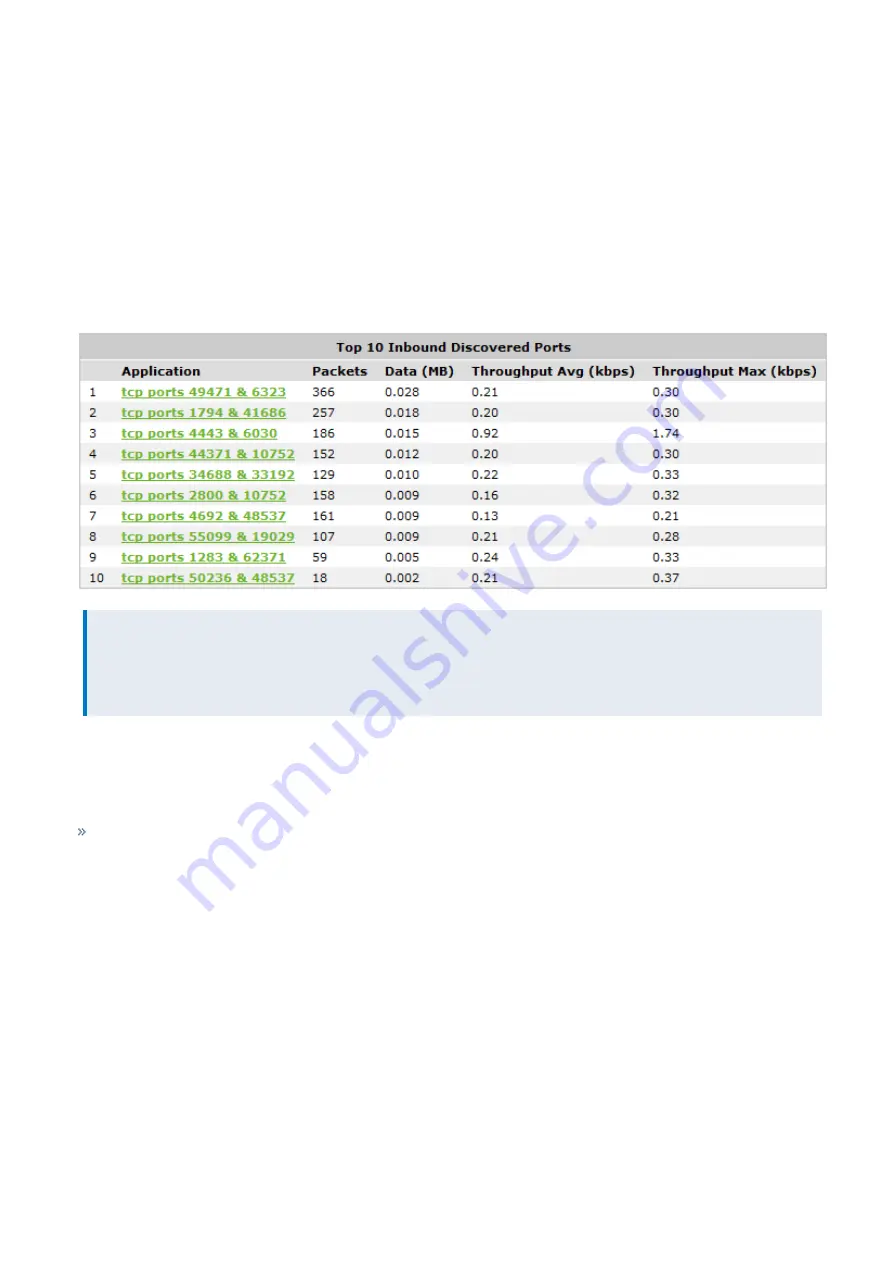
If unclassified applications are sending traffic through the Exinda Appliance, a link to Discovered Ports is displayed. To
display the unclassified applications, click
Displayed Ports
. The Discovered Ports report is displayed with source and des-
tination ports for each unclassified applications. Each discovered port can be broken down to the internal/external host
by clicking on the link. This helps to drill down and understand what the application really is and what it should be clas-
sified as.
NOTE
When deciding how to classify a discovered port, look for a common destination port. If more than two entries
appear with the same destination port, adding that port to an application object may classify the application
correctly.
Monitoring URLs visited
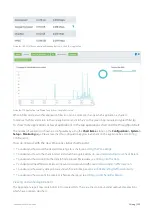
The URLs report shows the top URLs visited by data volume for the selected time period. The URLs report shows
inbound traffic separately from outbound traffic. This report answers questions such as:
Which websites are generating the most traffic?
Using this information you can determine if you need to create applications based on URLs and create policies to control
or protect high data volume URLs.
The URL names are represented as a domain/host name. Drill into the URLs by clicking on the URL name in the tables
below the charts. This will show the
which lists hoists that visited the URL.
Summary of Contents for EXNV-10063
Page 369: ...Exinda Network Orchestrator 4 Settings 369 ...
Page 411: ...Exinda Network Orchestrator 4 Settings 411 Screenshot 168 P2P OverflowVirtualCircuit ...
Page 420: ...Exinda Network Orchestrator 4 Settings 420 Screenshot 175 Students OverflowVirtualCircuit ...


