


Exinda Network Orchestrator
3 Using
|
250
Am I achieving the amount of reduction overall that I am expecting?
Is a specific application achieving the amount of reduction that was expected?
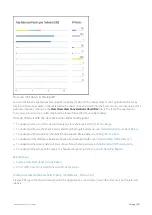
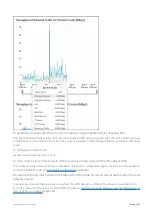
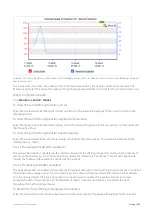
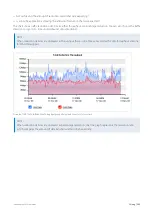
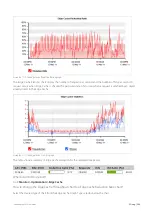
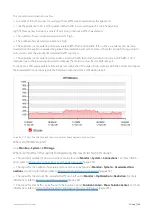
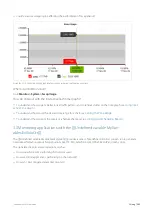
The chart shows traffic reduction over time as either throughput or percentage reduction. You can also choose the traffic
direction to report on - inbound, outbound, or bi-directional.
NOTE
When reduction statistics are displayed as throughput, there is one time series plotted for LAN throughput and one
for WAN throughput.
Screenshot 106: The Total Reduction Throughput graph displays reduction statistics over time.
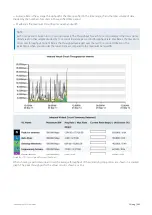
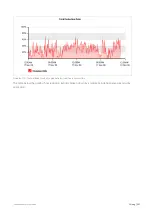
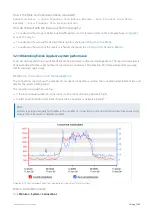
NOTE
When reduction statistics are displayed as percentage reduction, one line graph represents the reduction ratio,
which compares the amount of data transferred after or before Exinda:
Summary of Contents for EXNV-10063
Page 369: ...Exinda Network Orchestrator 4 Settings 369 ...
Page 411: ...Exinda Network Orchestrator 4 Settings 411 Screenshot 168 P2P OverflowVirtualCircuit ...
Page 420: ...Exinda Network Orchestrator 4 Settings 420 Screenshot 175 Students OverflowVirtualCircuit ...


