Exinda Network Orchestrator
3 Using
|
210
Looking at the results
Determining what might be causing a low APS score
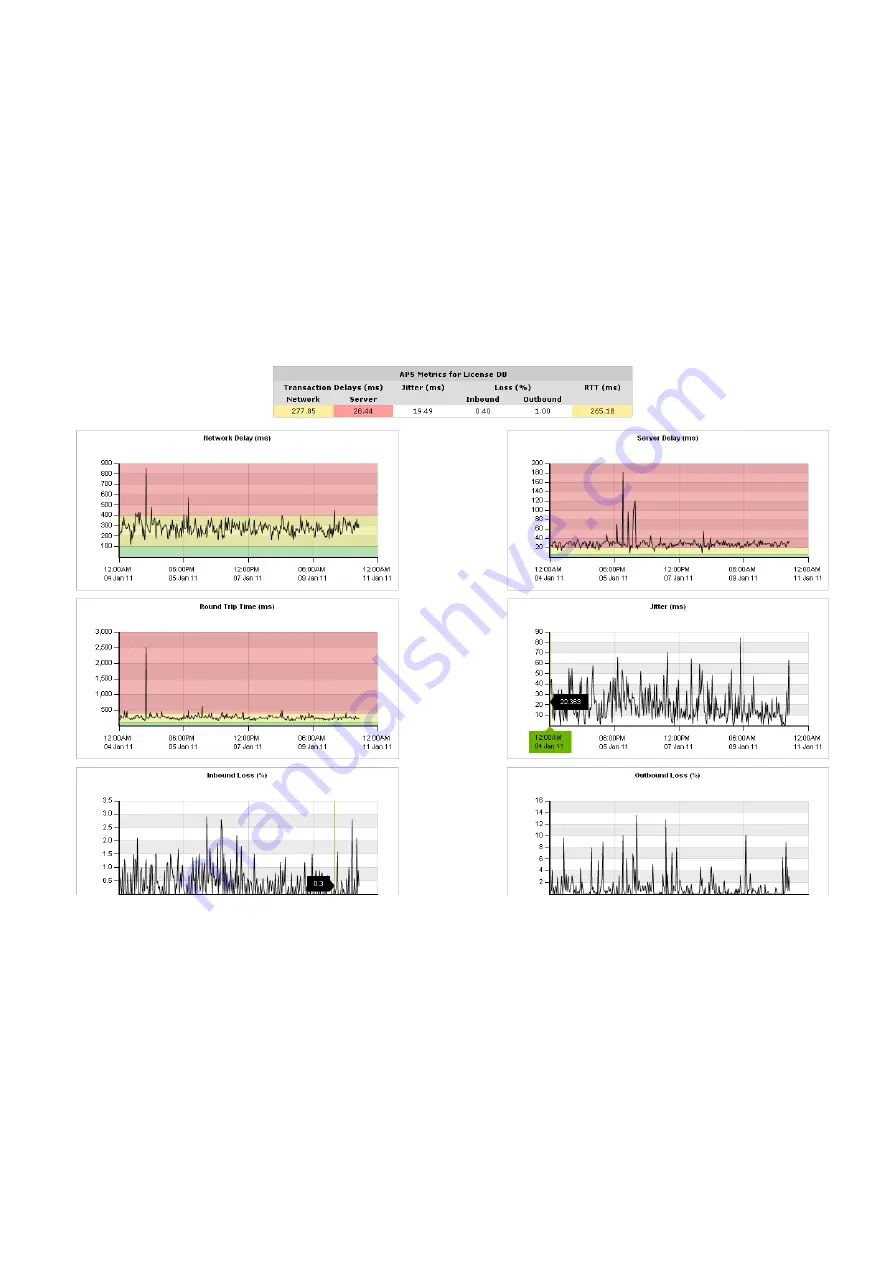
Click the APS name in the table. A new screen that shows charts for each underlying metric appears. The background of
each chart is colored to represent value within threshold, within 4 x threshold, and above.
If the background of the chart is not colored, that metric does not contribute to the calculation of the APS score. You can
zoom into these charts by clicking and dragging within a chart to zoom into the x-axis range. All other charts will
synchronize their zoom ranges to the specified zoom range.
The metrics showing poor values could indicate a problem to investigate. For example, if the network delay is good, but
the server delay is poor, you know that the network is not to blame and that the server administrator should take a look at
the application server.
Determining if a problem has been persistent
Look at the APS score time line. If the score has been low for an extended period or if it looks like the score is dropping,
you’ll know that this is a persistent problem that needs addressing.
Determining if you should pay attention to the normalized delays or the transaction delays
Generally, you should use the transaction delays unless the protocol that is being monitored has large or variable sized
packets. The normalized delay measure normalizes the score to reflect a 1024 packet size allowing you to more easily
compare delays when the packets are variable in size.
Summary of Contents for EXNV-10063
Page 369: ...Exinda Network Orchestrator 4 Settings 369 ...
Page 411: ...Exinda Network Orchestrator 4 Settings 411 Screenshot 168 P2P OverflowVirtualCircuit ...
Page 420: ...Exinda Network Orchestrator 4 Settings 420 Screenshot 175 Students OverflowVirtualCircuit ...


