


Exinda Network Orchestrator
3 Using
|
217
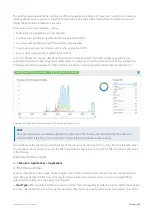
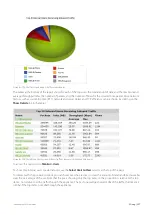
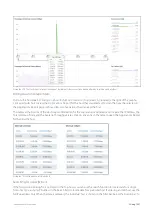
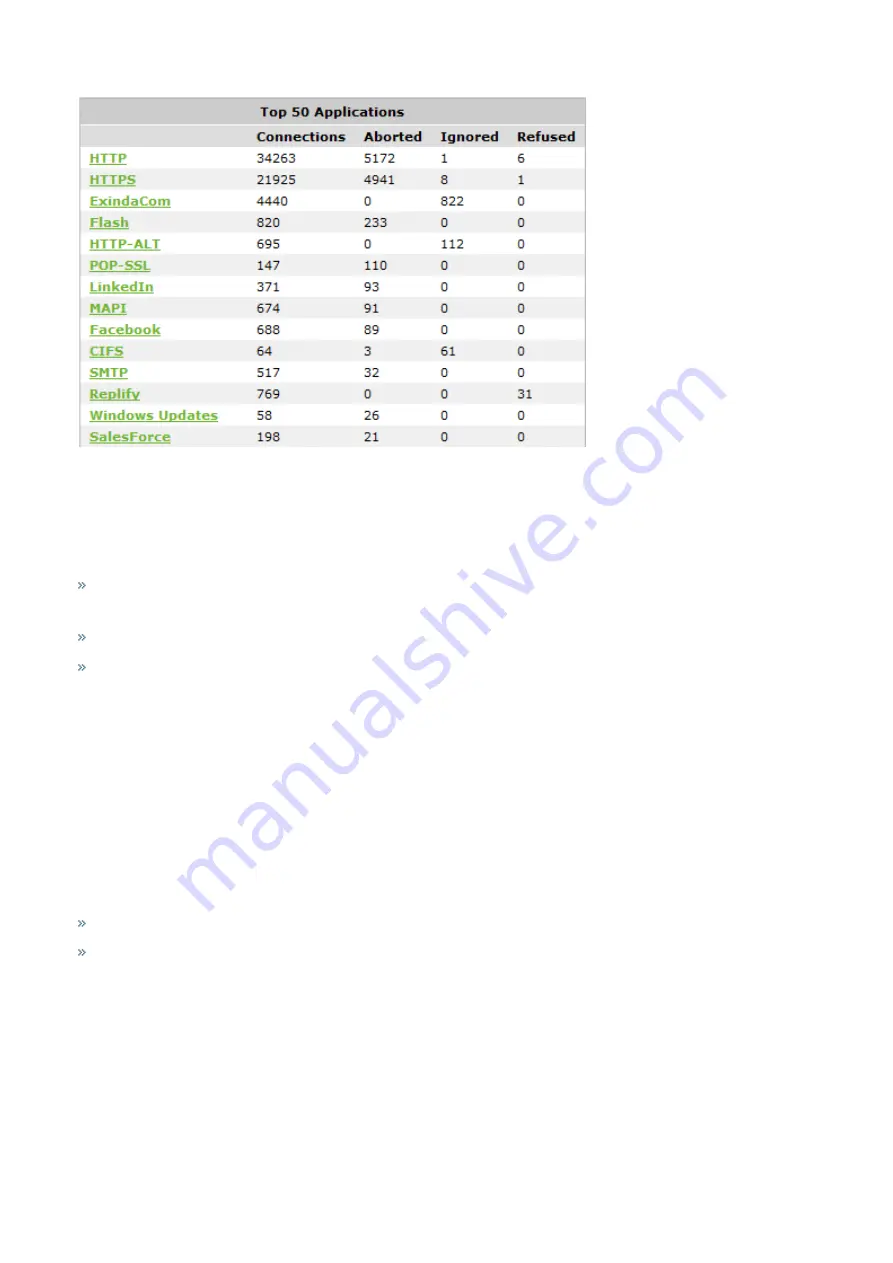
Screenshot 85: The TCP Health report displays the applications with the most connections.
Where do I find this report?
Go to
Monitor > Service Levels > TCP Health
.
How do I interact with the interactive flash time graphs?
To understand how to get a better look at traffic patterns and to remove clutter on the time graph, see
To understand how to set the desired time range for a chart, see
To understand how to print the report or schedule the report, see
Printing and Scheduling Reports
.
3.2.6 Monitoring applications
This section provides information about various reports that deal with the performance of your application groups,
individual applications, unclassified applications, and URLs.
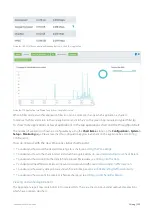
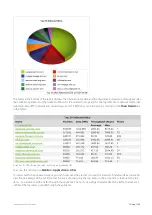
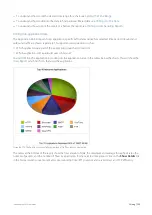
Monitoring application groups traffic
The Traffic Analysis Applications Groups report shows the top application groups by data volume for a selected time
period. Inbound and outbound traffic are shown separately.
This report answers questions such as:
Which application groups may be overrunning my network?
Is the proportion of traffic for a particular application group what I expect?
Use this information to determine if you need to create policies to control or protect high data volume application
groups.
You can drill into the application group by clicking on the application group name in the tables below the charts. This
shows the
which lists hosts in the selected application group. You can then drill into a particular
application to see the hosts using that application.
Summary of Contents for EXNV-10063
Page 369: ...Exinda Network Orchestrator 4 Settings 369 ...
Page 411: ...Exinda Network Orchestrator 4 Settings 411 Screenshot 168 P2P OverflowVirtualCircuit ...
Page 420: ...Exinda Network Orchestrator 4 Settings 420 Screenshot 175 Students OverflowVirtualCircuit ...


