84 • Site Manager User Manual
026-1012 Rev 3 06-DEC-2011
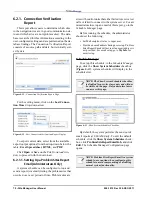
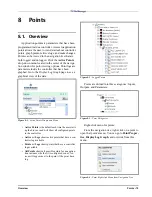
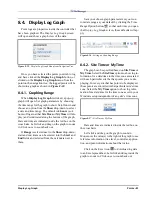
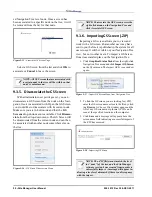
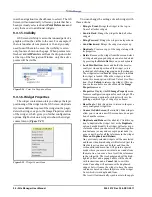
To print the log graph, click the Print icon.
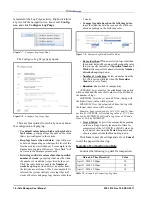
Ref-
erence information of points will show in the output
(information will display next to the legend).
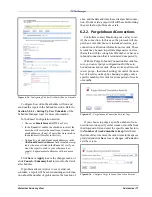
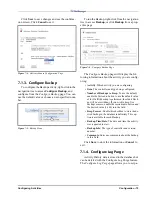
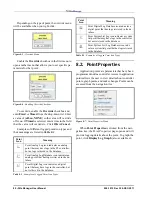
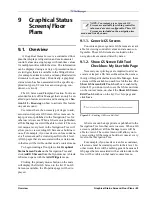
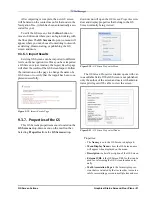
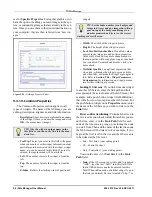
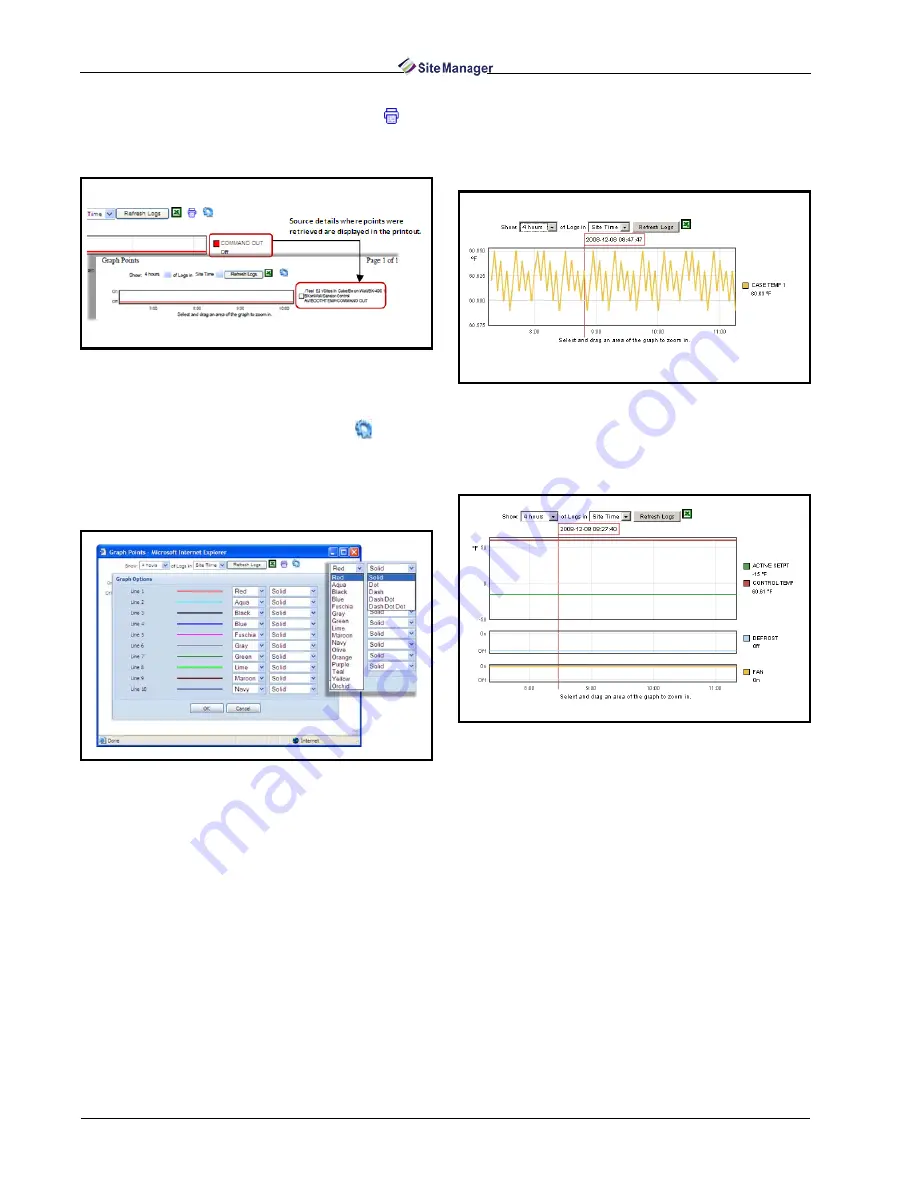
Configure the colors and styles of each line in the
graph by clicking the Graph Options icon.
You can
set the color and style of lines that will be used in the
graph based on your preference. Set the value of the
drop-downs and click OK to apply. Click Cancel to
exit and return to the graph.
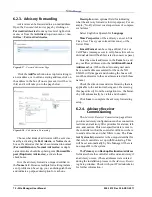
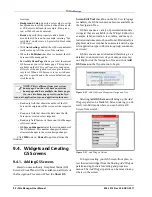
Click Refresh Logs to refresh the points that have
been logged.
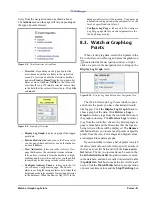
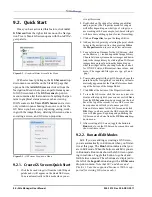
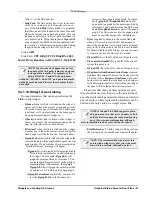
Mouse over the value(s) to the right of the graph
(for example, Case Temp 1) to see reference informa-
tion (tree level, controller, application, and point in-
formation) about that value.
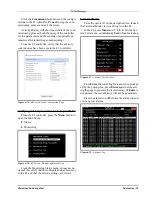
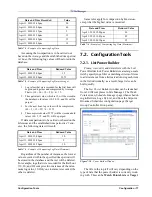
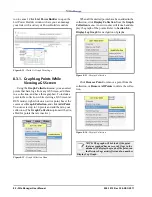
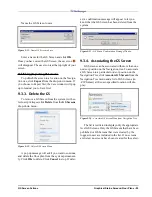
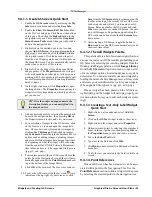
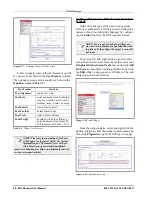
An example of a graphed digital information is
shown in Figure 8-21.
Move the cursor inside the graph to show time, en-
gineering units, and point information. When you
left-click inside the graph, the yellow bar appears and
marks the area to be zoomed in (as shown in Figure
8-21).
Click the Excel icon to export log data to an Excel
spreadsheet (.xls format) then Save or Open to ac-
cess.
Figure 8-18 - Print Graph
Figure 8-19 - Graph Options - Customizing Line Colors and
Styles
Figure 8-20 - Example of Graphed Logged Points (Case Temp 1
shown)
Figure 8-21 - Example of Graphed Digital Information
Summary of Contents for Site Manager
Page 1: ...026 1012 Rev 3 06 DEC 2011 Site Manager User Manual ...
Page 2: ......
Page 4: ......
Page 124: ......
Page 129: ......

