68 • Site Manager User Manual
026-1012 Rev 3 06-DEC-2011
6.2. Historical Advisory
View
The Historical Advisory View page displays the
current advisories (alarms, fails, notices, warnings)
from the database in high, medium, and low urgen-
cies. The Historical Advisory View is accessible from
any location in the navigation tree from the right-click
menu. The advisory alert icon (refer to Section 1.5.,
Site Manager Interface) appears when a new adviso-
ry is received and can be seen from any page in the
software. Clicking on the alert icon will open this
page so the advisory can be viewed. Once the adviso-
ry has been viewed the alert icon will turn off until an-
other advisory is received.
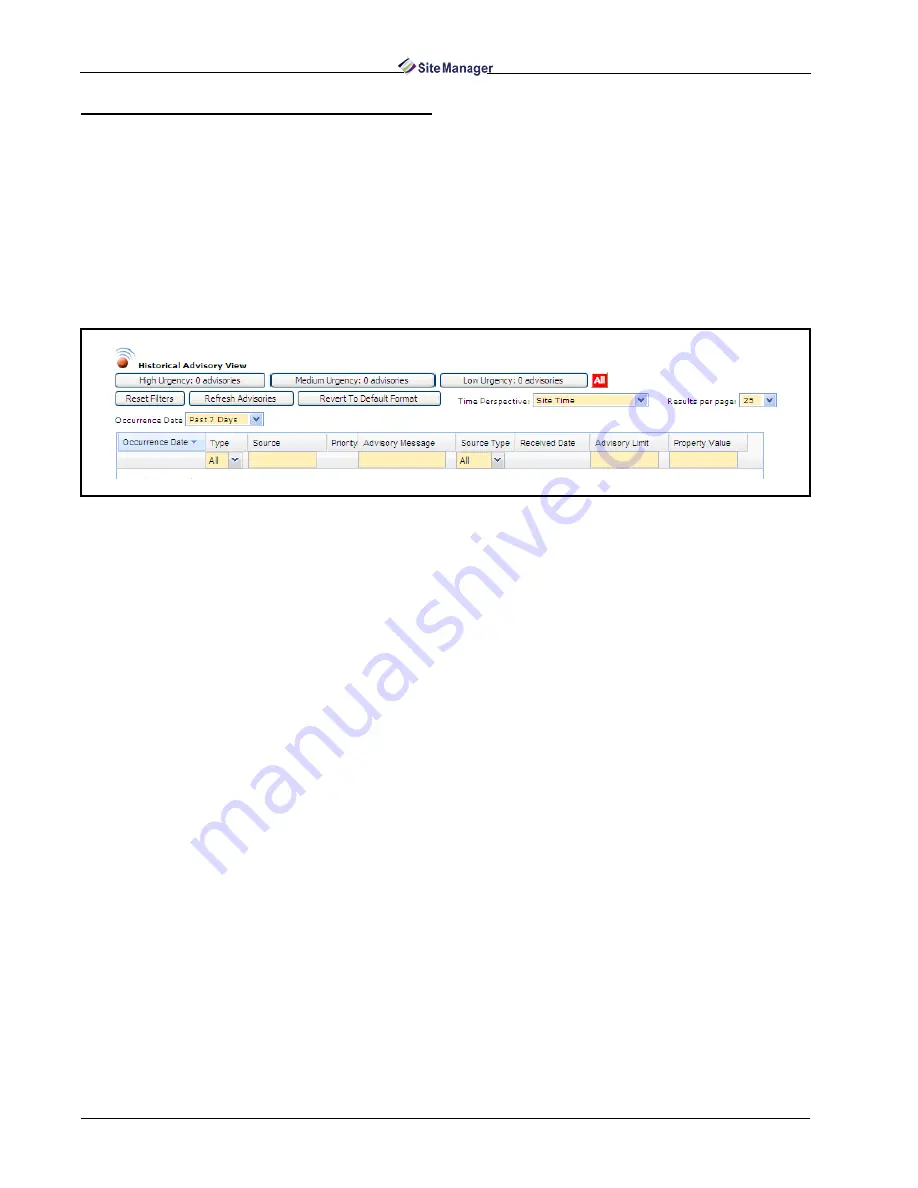
The Advisory screen is accessible from any loca-
tion in the navigation tree on the right-click menu or
point properties menu, and will look similar to
Figure 6-9:
• Choose which advisories to view from the Occur-
rence Date drop-down list. Advisories from Today,
Yesterday, Past 7 Days, and Last Month can be
viewed, or select All to show all historical adviso-
ries. You can also define a custom date range (Cus-
tom Range) to display live advisories within the
date you specified.
• Select the type of advisory that you would like to
view from the Type drop-down list (alarm, notice,
fail, or warning) and whether it was returned to nor-
mal (RTN).
• Alarms are high-priority warnings about im-
portant system conditions that need immediate
attention.
• Notices are low-priority messages that signify a
condition or system change that requires no im-
mediate attention, or may be a symptom of a
condition that may require attention in the fu-
ture.
• Failures are pre-programmed advisories that
are generated when a controller or device fail-
ure occurs, such as a board going off-line or a
sensor short.
• Warning is a type of advisory dependent on the
type of controller used.
• Source - Shows parent controller (from which con-
troller the advisory was generated), application, and
property information about the advisory. Click this
header to alphabetized Source entries.
• Priority - Details the level of urgency placed on the
advisory (high, medium, or low expressed as a nu-
merical value). Click on this header to arrange advi-
sories in descending level of priority, 1 being the
highest.
• Advisory Message - Details any message from the
controller or device that accompanies the advisory
(protocol advisory message that comes from the
control system).
• Source Type - Shows the software application from
which the advisory was generated. Click this header
to alphabetize Source Type entries.
• Received Date - Reports when the advisory was
first detected.
• Advisory Limit - Reports on the high and low limit
the advisory exceeded that generated the advisory.
• Property Value - Shows the property name of the
application from where the advisory was generated.
You can also organize the advisories that appear
on this page by clicking the buttons along the top la-
beled: High Urgency, Medium Urgency, or Low
Urgency and the advisories will be filtered respec-
tively in descending order (most current advisories
appear first at the top of the list). Click the All button
to see all advisories displayed in descending order.
Figure 6-9 - Historical Advisory View Page
Summary of Contents for Site Manager
Page 1: ...026 1012 Rev 3 06 DEC 2011 Site Manager User Manual ...
Page 2: ......
Page 4: ......
Page 124: ......
Page 129: ......

