Watch or Graph Log Points
Points • 81
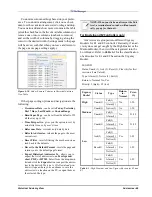
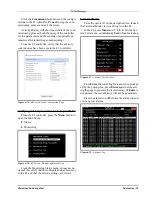
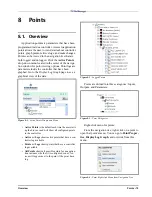
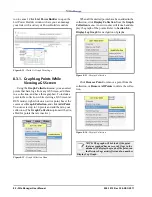
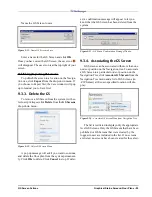
rectly from the navigation menu as shown above).
The Actions menu on the page will vary depending on
the type of point selected.
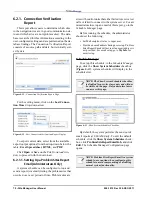
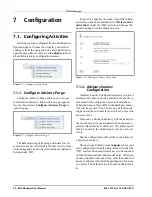
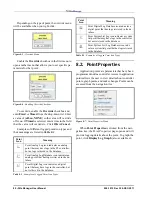
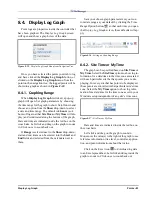
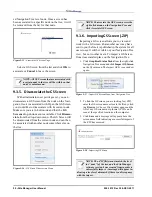
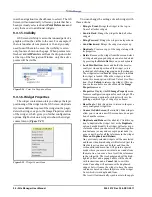
• Override - Depending on the type of point, the
override menu will be available in the right-click
menu. To override, enable the Override checkbox
and enter Fixed or Timed from the drop-down list.
Enter a value of (off, on, NONE) so the value will
override off or on. If Timed is selected, enter a time
in the field that the value will override to. Click OK
or Cancel.
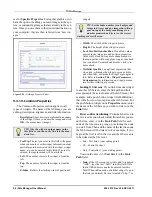
• Display Log Graph - displays a graph of the logged
point data.
• Forward Advisories - takes you to the Forward Ad-
visories page where advisories can be forwarded to
an e-mail address.
• View Advisories - takes you to the Advisory View
page that displays the current advisories (alarms,
fails, notices, warnings) from the database in high,
medium, and low priorities, and gives you the ability
to search advisories using various search criteria.
• Configure Advisory Snooze - takes you to the Ad-
visory Snooze Configuration page. The Snooze
alarm is a setting that assigns alarms a wait time that
helps reduce the total amount of recurring advisories
in the database. When the Snooze flag is ON in the
database, advisories will be snoozed. You can set up
a default snoozing period at the customer level, site
level, or specific advisory level.
• Configure Log Purge - takes you to the Configure
Log Purge page where you can set parameters for
the Log Purge activity.
8.3. Watch or Graph Log
Points
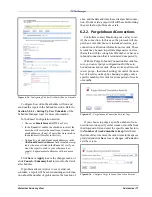
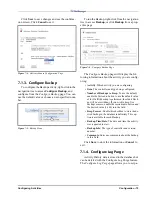
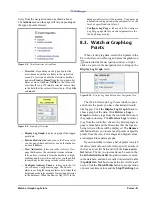
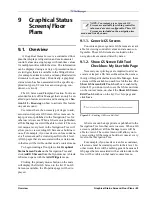
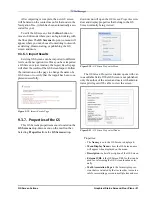
When viewing log data, select which points in the
E2 controller you wish to log and press the graph icon
located inside the navigation window, or right-
click on a point in the navigation tree to bring up the
Display Log Graph menu.
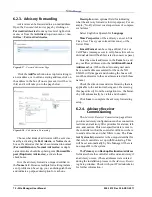
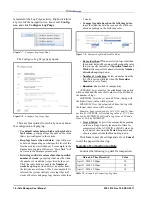
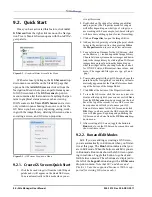
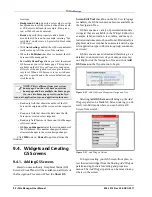
The Watch Or Graph Log Points window opens
and shows the points you have checked and would
like logged. Click the Display Log Graph button to
show a graph of the data. Click Retrieve Logs +
Graph to retrieve logs from the controller and show
the graph in one step. Click Retrieve Logs to retrieve
logs from the controller: the activity details progress
page is launched and the directories that the logs are
being retrieved from will be displayed. The Remove
All button allows you to remove all points or specific
points from the view. Percentages and digital values
are displayed in separate graphs.
If you would like to create a list of points to watch
(monitor point values in real-time), specify a name in
the Save as new list field and click the Save as new
list button. The list you just made can be seen in the
Load Selection from list drop-down menu, is saved
in the database, and can be recalled or deleted. Enable
the public list checkbox to make the list visible to all
users. Click the Watch Points button to see operation
of point real-time values and the Stop Watching but-
Figure 8-8 - Point Properties Action Menu
Figure 8-9 - Example of Override
Figure 8-10 - Display Log Graph Menu from Navigation Tree
Summary of Contents for Site Manager
Page 1: ...026 1012 Rev 3 06 DEC 2011 Site Manager User Manual ...
Page 2: ......
Page 4: ......
Page 124: ......
Page 129: ......


