Run Up / Coast Down Module
Displaying Acquired Data
•
Press and hold the “shift function” button (0 / up arrow), then press the “+-” key to
perform a z-axis zoom around the current cursor position. The waterfall re-draws
as it zooms on the active trace, and the Display Status Area updates to indicate the
number and position of spectra displayed. Repeat the procedure to continue
zooming in and, after reaching the last zoom level, to zoom back out.
The fewer spectra displayed, the more zoom levels available.
If you cursor past the last spectrum in a zoomed display, the Z-axis pans to show the
next set of traces at the same zoom level.
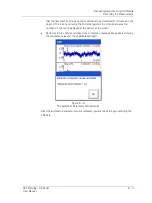
Figure 7 - 22.
An Example of Z-Axis Zoom with
No. Spectra
set to 5.
7 - 22
SKF Microlog - GX Series
User Manual


