


Run Up / Coast Down Module
Saving RUCD Data
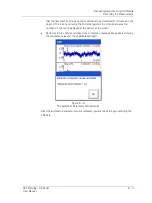
At the bottom of the spectrogram plot, a “display status” area indicates the plot’s color
scale from lowest to highest amplitude, and the color (amplitude indicator) for the
cursor position on the active trace.
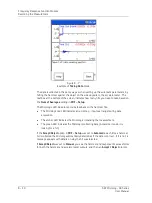
Cursor Movement
On the displayed spectrogram plot:
•
Up and down arrow buttons sequence through displayed spectra.
•
Left and right arrow buttons move the cursor on the active spectrum.
Tip
- Press the “P” key (7 PQRS key) to quickly jump the cursor to
the highest Peak to the right.
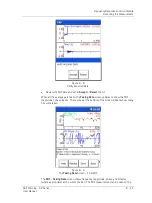
If necessary, press the
Back
function button to return to the
RUCD – Spectrogram Setup
screen to change spectrogram
analysis options and extract new spectral data for the waterfall
display.
Saving RUCD Data
Saving, Reviewing, and Deleting Measurements
Procedures for saving measurement setups, for saving measurement results, for
viewing stored measurements, and for deleting stored measurements are similar
between modules. Reference
Chapter 4, The Analyzer Module
section on
How to
Save, View, and Delete Analyzer Measurement Results
for detailed information on
these procedures.
7 - 26
SKF Microlog - GX Series
User Manual