


Run Up / Coast Down Module
Displaying Acquired Data
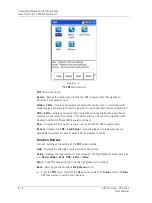
Waterfall Display Setup
menu options allow you to optimise the display by adjusting
settings that control how the processed spectra appear in the waterfall plot. After the
waterfall plot is displayed, these settings may be re-adjusted, without reprocessing the
spectra, using the waterfall display’s
Edit
function button.
Options include:
Z-Axis
– (
RPM
,
Timestamp
, or
Even Spacing
) – Specify how to space the waterfall
plot’s spectra:
RPM
– spectra are spaced by speed increments.
Timestamp
– spectra are spaced by time increments (in seconds).
Even Spacing
– spectra are spaced evenly from the first captured to the last
captured.
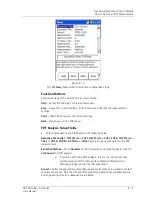
Figure 7 - 14.
Example of
Z-Axis
Timestamp, Even
, and
RPM Spacing
.
No. Spectra
–
Of the total available spectra, specify the number of spectra to display in
the waterfall plot (maximum 60). The specified number of spectra display evenly across
the waterfall plot’s entire speed or time range.
Figure 7 - 15.
Example
No. Spectra
Settings of 20 and 38.
SKF Microlog - GX Series
7 - 17
User Manual


