2. GRAPH FUNCTIONS
2-13
2
2.3
Fish Size Graph
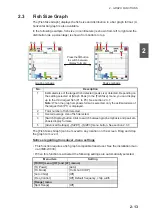
The [Fish Size Graph] displays the fish size and distribution in a bar graph format. (A
horizontal bar graph is also available.
In the following example, fish size (in centimeters) is shown from left to right and the
distribution (as a percentage) is shown from bottom to top.
The [Fish Sizes Graph] can be moved to any location on the screen. Drag and drop
the graph to move it.
Notices regarding transducer, menu settings
• This function requires a fish graph compatible transducer. See the installation man-
ual (IME-23930).
• When this function is activated the following settings are automatically selected.
No.
Description
1
Estimated size of the largest fish detected (peak size) detected. Depending on
the setting selected at [Graph Peak] in the [Fish Size] menu, you can display
up to the third largest fish (P1 to P3). See section 2.3.7.
Note:
When the graph emphasis format is selected, only the estimated size of
the largest fish (P1) is displayed.
2
Total number of fish detected.
3
Overall average size of fish detected.
4
[Switch Display] button. Click to switch between graph emphasis and peak em-
phasis display formats.
5
[Advanced Settings] - [SIZE1] - [SIZE3] menu button. See section 2.3.7.
Menu item
Setting
[TX/RX] menu ([HF] and [LF] menus)
[TX Power]
[Auto]
[TX Mode]
[TruEcho CHIRP]
[Auto Chirp]
[Off]
[Freq Control]
[Off] Default frequency, chirp width
[Range] menu
[Split Range]
[Off]
Graph emphasis
Peak emphasis
Press the button
to switch between
display formats.
Summary of Contents for FSS-3BB
Page 12: ...SYSTEM CONFIGURATION x This page is intentionally left blank...
Page 98: ...4 ADVANCED SETTINGS 4 20 This page is intentionally left blank...
Page 110: ...5 MAINTENANCE AND TROUBLESHOOTING 5 12 This page is intentionally left blank...
Page 119: ......
Page 120: ......
Page 121: ......


