2. GRAPH FUNCTIONS
2-2
2.2
IDENTI-FISH
™
The FSS-3BB compares the histograms of schools of fish with the model data within
the measurement range, and indicates the similarity of fish species by numerical val-
ues and bar graphs. This graph is called the "IDENTI-FISH
™
graph.".
In the following display example, the fish within the measurement range are similar to
herring with a 96% accuracy.
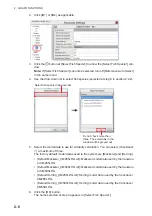
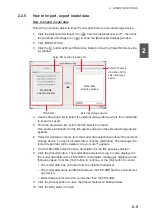
* Displayed only when model data is set. Set the model data in the [ID1] (or [ID2])
menu in the [IDENTI-FISH] menu. See section 2.2.4.
You can freely change the window size of the graph by dragging the window frame.
You can also move the graph position by dragging and dropping the graph.
2.2.1
How to display the IDENTI-FISH
™
graph
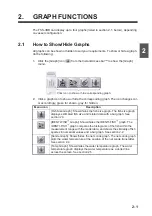
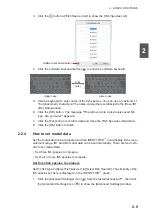
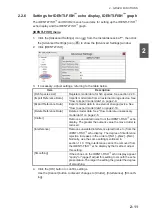
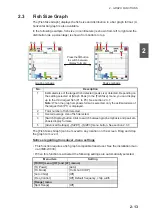
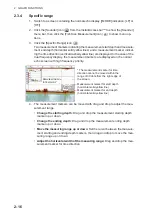
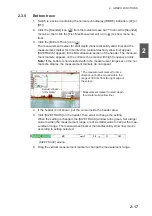
On the InstantAccess
™
bar, click the [Graph] icon (
) followed by the [IDENTI-FISH
Graph] icon (
). The icon is highlighted in green and the graph appears. To hide the
graph, click the close button ( )
No.
Description
1
[Save ID1 (or ID2) Data] button. Click this button to open the [Save ID1 (or ID2)
Data] window.
2
[Advanced Settings] button. Click the button to open the IDENTI-FISH
™
[ID1]
([ID2]) menu.
3
The IDENTI-FISH
™
histogram within the measurement range (ID1: blue, ID2:
pink) and the histogram* of the past model data (up to three for each model da-
ta) are displayed. The color of the histogram of each model data corresponds
to the color of the bar graph of similarity (see No. 4).
4
The fish species name of each model data* and the similarity to the model data*
(shown by numerical values and bar graphs) are displayed (up to three).
Model data1 (yellow)
Model data1 (yellow)
Model data2 (red)
Model data2 (red)
Model data3 (green)
Model data3 (green)
Summary of Contents for FSS-3BB
Page 12: ...SYSTEM CONFIGURATION x This page is intentionally left blank...
Page 98: ...4 ADVANCED SETTINGS 4 20 This page is intentionally left blank...
Page 110: ...5 MAINTENANCE AND TROUBLESHOOTING 5 12 This page is intentionally left blank...
Page 119: ......
Page 120: ......
Page 121: ......


