2. GRAPH FUNCTIONS
2-3
2
2.2.2
How to set the measurement range for the IDENTI-FISH
™
graph
Note:
The following setting can also be performed using recorded echo data.
1. Show the IDENTI-FISH
™
echo display in the single or combination display.
2. On the InstantAccess
™
bar, click the [Sounder] icon (
) followed by the [IDENTI-
FISH] icon (
).
3. If the header is not displayed, put the cursor at the top edge of the screen.
4. Click [ID AREA] in the header, then scroll to select [ID1] or [ID2]. The [ID AREA]
indication is highlighted in green. You can set two measurement ranges ([ID1],
[ID2]) on the IDENTI-FISH
™
echo display.
5. Place the cursor at the top-left corner of the area. Push the left button, drag the
frame to the location for the bottom-right corner, then release the left button. A
IDENTI-FISH
™
graph appears for the ID no. selected at step 4. If model data has
been set, the model data histogram, fish species name, and similarity value (nu-
merical value and bar graph) are displayed.
Note:
You can adjust the location and size of the area by turning off [Selected
Area Scroll] in the [IDENTI-FISH] menu. See page 2-12.
6. Do steps 4 and 5 to set the other area, if necessary.
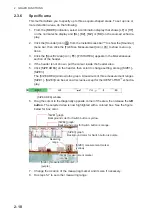
[ID AREA]
Measurement range (ID:1 Blue frame, ID2: Pink frame)
Measurement range (ID:1 Blue frame, ID2: Pink frame)
[ID1] IDENTI-FISH
TM
graph
䠖
IDENTI-FISH
TM
histogram is blue.
[ID1] IDENTI-FISH
TM
graph
䠖
IDENTI-FISH
TM
histogram is blue.
[ID2] IDENTI-FISH
TM
graph
䠖
IDENTI-FISH
TM
histogram is pink.
[ID2] IDENTI-FISH
TM
graph
䠖
IDENTI-FISH
TM
histogram is pink.
Summary of Contents for FSS-3BB
Page 12: ...SYSTEM CONFIGURATION x This page is intentionally left blank...
Page 98: ...4 ADVANCED SETTINGS 4 20 This page is intentionally left blank...
Page 110: ...5 MAINTENANCE AND TROUBLESHOOTING 5 12 This page is intentionally left blank...
Page 119: ......
Page 120: ......
Page 121: ......


