2-1
2
2.
GRAPH FUNCTIONS
The FSS-3BB can display up to four graphs (listed in section 2.1, below), depending
on vessel configuration.
2.1
How to Show/Hide Graphs
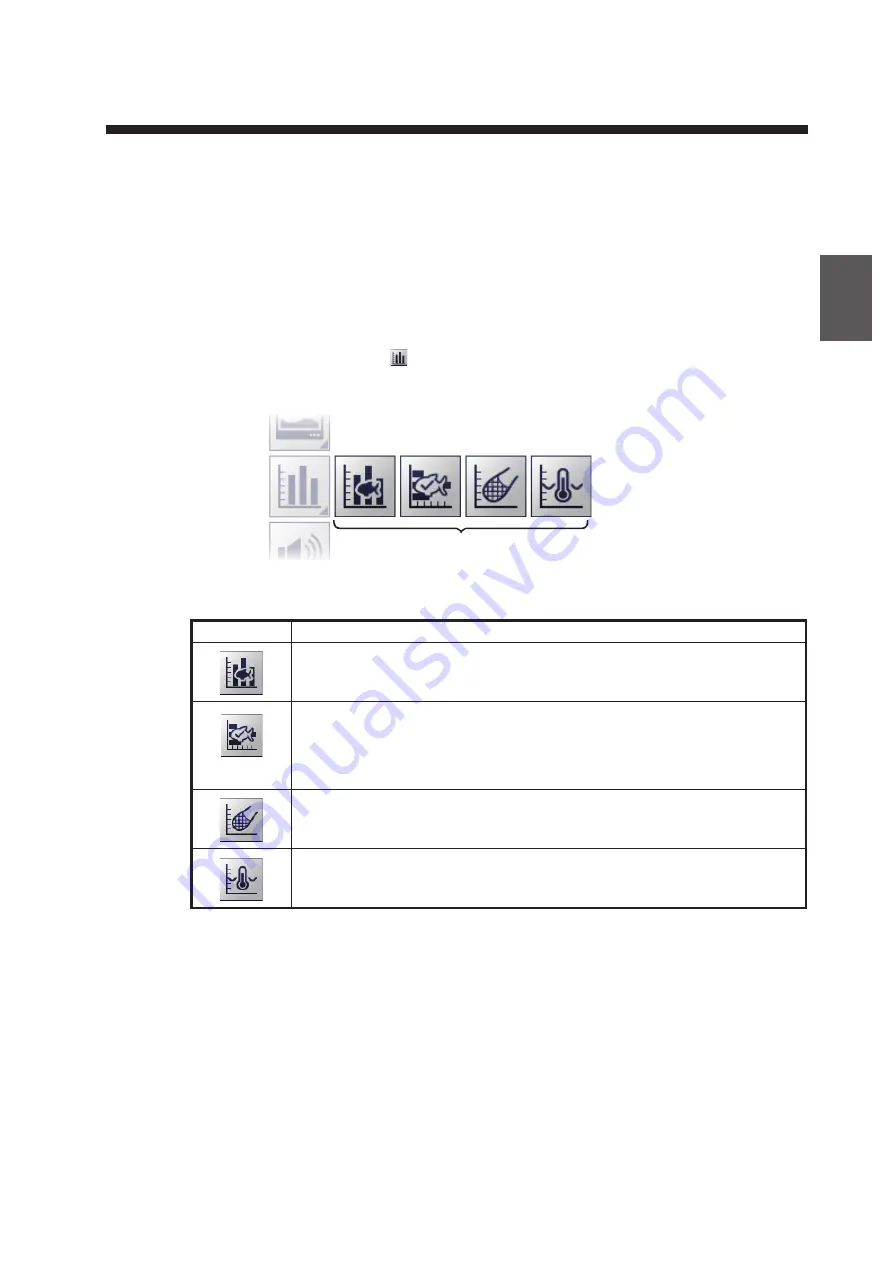
All graphs can be shown or hidden to suit your requirements. To show or hide a graph,
do the following:
1. Click the [Graph] icon (
) from the InstantAccess bar™ to show the [Graph]
menu.
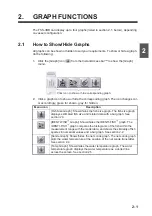
2. Click a graph icon to show or hide the corresponding graph. The icon changes col-
or accordingly, green for shown, gray for hidden.
Menu icon
Description
[Fish Size Graph]: Shows/hides the fish size graph. The fish size graph
displays estimated fish size and related data with a bar graph. See
section 2.3.
[IDENTI-FISH
™
Graph]: Shows/hides the IDENTI-FISH
™
graph. The
IDENTI-FISH
™
graph compares the histograms of the fish within the
measurement range with the model data, and shows the similarity of fish
species in numerical values and a bar graph. See section 2.2.
[Sonde Graph]: Shows/hides the net sonde graph. The net sonde graph
plots the water temperature at the position of the net sonde transmitter.
See section 2.4.
[Temp Graph]: Shows/hides the water temperature graph. The water
temperature graph displays the water temperature as a dotted line
across the screen. See section 2.5.
Click icon to show or hide corresponding graph.
Click icon to show or hide corresponding graph.
Summary of Contents for FSS-3BB
Page 12: ...SYSTEM CONFIGURATION x This page is intentionally left blank...
Page 98: ...4 ADVANCED SETTINGS 4 20 This page is intentionally left blank...
Page 110: ...5 MAINTENANCE AND TROUBLESHOOTING 5 12 This page is intentionally left blank...
Page 119: ......
Page 120: ......
Page 121: ......


