Pearl Nano User Guide
Diagnostic tools
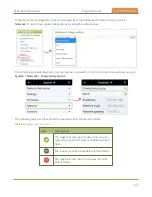
Using the Admin UI, diagnostic tools are accessed from the Configuration menu when you select
Network
. To learn how, see
Run diagnostic tests using the Admin panel
The Connectivity status diagnostic tool can also be accessed from the front screen menu when you select
System > Network > Connectivity status
.
The following table describes what the colored icons in the results indicate.
Table 69
Diagnostic test result icons
Icon
Description
The diagnostic test result is okay. This can also
mean that a specific feature is enabled on Pearl
Nano.
The feature or option is disabled on Pearl Nano.
The diagnostic test result is not okay. An error
was detected.
445
Содержание Pearl Nano
Страница 1: ...Epiphan Pearl Nano User Guide Release 4 14 2 June 7 2021 UG125 03 and 2021 Epiphan Systems Inc ...
Страница 100: ...Pearl Nano User Guide Disable the network discovery port 87 ...
Страница 315: ...Pearl Nano User Guide Start and stop streaming to a CDN 302 ...
Страница 325: ...Pearl Nano User Guide Viewing with Session Announcement Protocol SAP 312 ...
Страница 452: ...Pearl Nano User Guide Register your device 439 ...
Страница 484: ... and 2021 Epiphan Systems Inc ...


