


Mil1394 Protocol support
246
Copyright © DapTechnology B.V., 2005-2019 - All Rights Reserved., 5/20/2019
tab page. The 'Field' tab page shows the fields and their values in a tree and the 'Layout' tab page shows
the fields and their values in the layout of the highlighted Mil1394 packet.
13.2.2. How to use it
To show the Protocol View click menu item 'View | Protocol View' of the Recorder. The Protocol View will
be displayed in the lower part of the Recorder.
IMPORTANT:
To enable the Mil1394 Protocol analyzer a valid license key has to be installed. An exception is made for
Recorder files, which were made with an Analyzer, with a Mil1394 license key installed.
The Mil1394 Protocol analyzer is able to analyze recorded data in the Recorder if it has knowledge of the
nodes on the bus, which support the Mil1394 Protocol. The Mil1394 Protocol analyzer has to know the
following information of a node, which support the Mil1394 Protocol: its name, the assigned channel
number, the heartbeat and the time slots. The time slots are necessary to identify the Transmit packets of
the node, Receive packets of the node and DataPump packets of the node.
This information is to be provided manually in the 'Protocol Analyzer Settings' dialog or via an import file.
You can load an import file via the 'Protocol Analyzer Settings' dialog. See the description of the 'Protocol
Analyzer Settings' below for more information.
A default import file can be set in tab page protocols of dialog 'Settings'. You can open dialog 'Settings'
via menu item 'Analyzer | Settings'. The default import file will be loaded during start up of the Analyzer
application.
13.2.3. Details
The Protocol View consists of a toolbar positioned at the top, with three panes below it: 'relation tree'
pane, 'detail' pane and 'transactions / packets' pane.
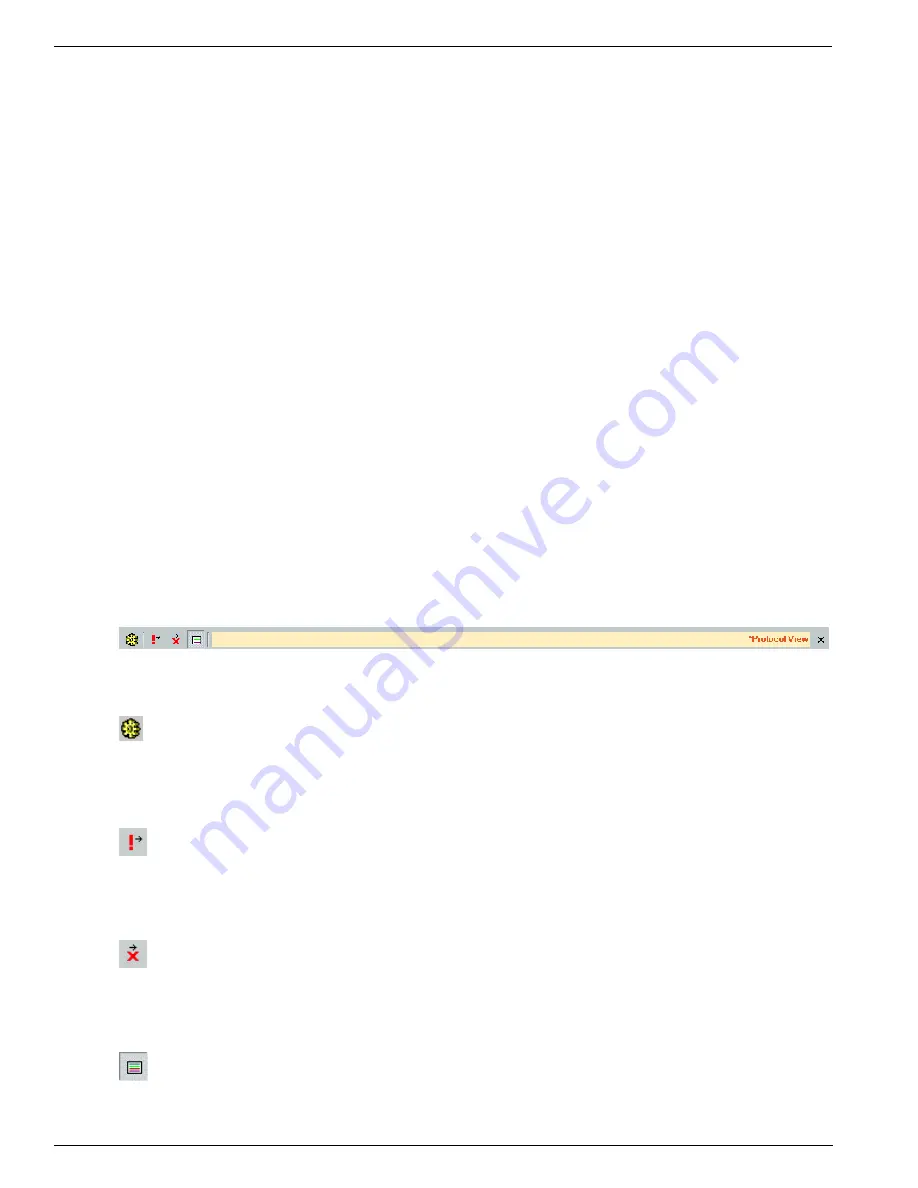
13.2.3.1. Toolbar
At the top of the Protocol View you will find a toolbar with several tool-buttons:
In front of the name 'Protocol View' a star '*' will be displayed if the protocol-analysis settings have been
modified.
Settings
When clicking this button, the 'Protocol Analyzer Settings' dialog will be displayed. It shows information
used by the protocol analyzers. It initially shows information that was found automatically and you will be
able to change or add information. See 'Protocol Analyzer Settings' below for more information.
Go to next relation tree item with warning(s)
When clicking this button, the relation tree item that contains one or more warnings will be selected. If
multiple protocols have been analyzed, clicking this button while pressing the control key will jump to the
next protocol tab that has any items with a warning.
Go to next relation tree item with error(s)
When clicking this button, the next relation tree item that contains one or more errors will be selected. If
multiple protocols have been analyzed, clicking this button while pressing the control key will jump to the
next protocol tab that has any item with an error.
Show transactions sequence
This button toggles the display of the 'transactions / packets' pane at the right side of the Protocol View.
Содержание 1394
Страница 1: ...1394 Analyzer Operation Manual Hardware and Software Guide Doc DT PRO134MAN700E ...
Страница 11: ...1394AnalyzerOperationManual 11 456 The SCSI2 Connector 457 The SUBD connector ...
Страница 187: ...Scriptor 187 Copyright DapTechnology B V 2005 2019 All Rights Reserved 5 20 2019 ...
Страница 199: ...Scriptor 199 Copyright DapTechnology B V 2005 2019 All Rights Reserved 5 20 2019 ...
Страница 363: ...FormatEditor 363 Copyright DapTechnology B V 2005 2019 All Rights Reserved 5 20 2019 ...


