Three Available Views
The Output Levels measurement provides three different graphical
views to visualize the calculated results:
•
BER versus Threshold
This graph shows the relationship between the analyzer decision
threshold and the resulting BER. It presents the raw data.
•
dB Histogram versus Threshold
This graph shows the relationship between the analyzer decision
threshold and the derivative of the bit error rate (dBER/dTh). A
Gaussian marker allows you investigate the peaks of this graph.
•
Q from BER versus Threshold
This graph shows the extrapolation of the Q-factor and the optimum
threshold level from a limited number of measured points.
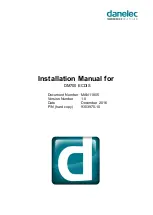
Example Results
The following illustration shows the
BER versus Threshold
graph of a
simple Output Levels measurement:
5
Advanced Analysis
196
Agilent J-BERT N4903 High-Performance Serial BERT
Содержание J-BERT N4903
Страница 1: ...S Agilent J BERT N4903 High Performance Serial BERT User Guide s Agilent Technologies...
Страница 68: ...2 Setting up Patterns 68 Agilent J BERT N4903 High Performance Serial BERT...
Страница 158: ...4 Setting up the Error Detector 158 Agilent J BERT N4903 High Performance Serial BERT...
Страница 314: ...6 Evaluating Results 314 Agilent J BERT N4903 High Performance Serial BERT...
Страница 374: ...7 Jitter Tolerance Tests 374 Agilent J BERT N4903 High Performance Serial BERT...
Страница 394: ...8 Solving Problems 394 Agilent J BERT N4903 High Performance Serial BERT...
Страница 434: ...Index 434 Agilent J BERT N4903 High Performance Serial BERT...