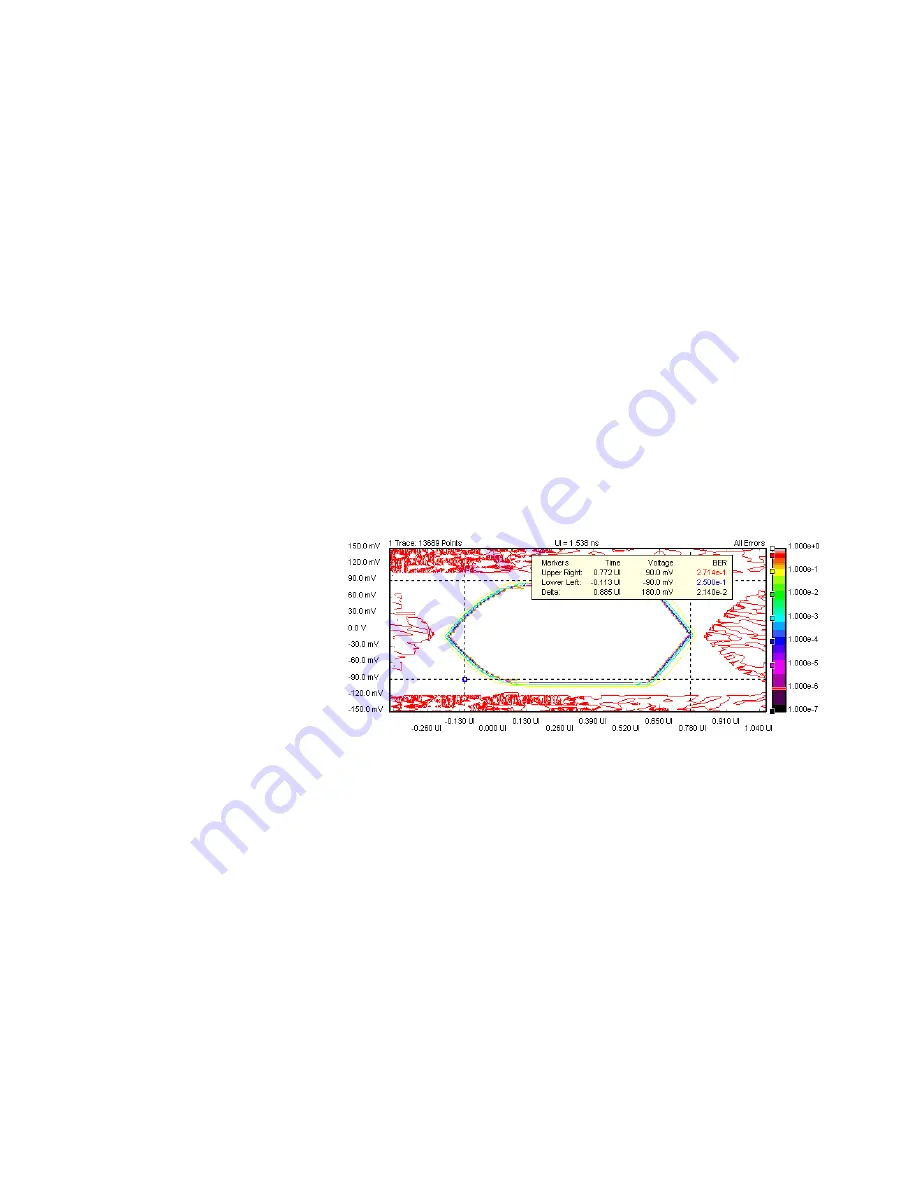
measurement. You can also drag and drop the horizontal BER
threshold in the graphical display to change this value.
You can select the number of
Decimal Places
to be displayed in the table.
Graph Tab
On the
Graph
tab, you can use the several options to optimize the
graphical display according to your needs.
Choose between
Unit Interval
and
Seconds
to select the timebase for the
display's x-axis.
To analyze the graphs at a particular point, you can use the markers.
Additionally, you can display all related values for the markers in the
marker readout.
Pressing the
Reset Markers
button will set the markers back to the default
positions.
Several zoom factors are available. When you show the zoom graph, you
can also allow the zoom graph to track the mouse (or your finger, if you
are working directly on the Serial BERT).
If you want to see the points that have actually been measured, choose
Show Measured Points
. The MUI uses linear interpolation for the graph.
If you want to display the BER threshold contour line, choose
Show BER
Threshold
. The BER threshold is set on the
View
tab or by the slider in
the Color Bar.
5
Advanced Analysis
234
Agilent J-BERT N4903 High-Performance Serial BERT
Table Number Format
Timing Units
Markers
Zoom
Show Measured Points
Show BER Threshold
Содержание J-BERT N4903
Страница 1: ...S Agilent J BERT N4903 High Performance Serial BERT User Guide s Agilent Technologies...
Страница 68: ...2 Setting up Patterns 68 Agilent J BERT N4903 High Performance Serial BERT...
Страница 158: ...4 Setting up the Error Detector 158 Agilent J BERT N4903 High Performance Serial BERT...
Страница 314: ...6 Evaluating Results 314 Agilent J BERT N4903 High Performance Serial BERT...
Страница 374: ...7 Jitter Tolerance Tests 374 Agilent J BERT N4903 High Performance Serial BERT...
Страница 394: ...8 Solving Problems 394 Agilent J BERT N4903 High Performance Serial BERT...
Страница 434: ...Index 434 Agilent J BERT N4903 High Performance Serial BERT...