L-DALI User Manual
94
LOYTEC
Version 5.2
LOYTEC electronics GmbH
To look at the historical trend data in a chart view select the
Preview
tab as shown in Figure
90. Trend logs with multiple data points are shown with multiple color-coded curves. A
legend at the bottom of the page identifies the trended data points. Moving the mouse over
the trend chart shows a data curser displaying time stamp and actual value.
Using the chart slider below the trend chart, one can zoom in and out in time as well as shift
the time axis. Click into the slider and drag the mouse while keeping the button pressed in
order to span a sub-interval, which is displayed in the chart view. Alternatively, select one
of the pre-defined sub-intervals (week, day, etc.) and drag the sub-interval along the time
axis.
Data points can be deselected in the legend at the bottom of the window. This hides the
respective curves in the chart view and may improve visibility for certain detail. Enable the
data points again and the curves will re-appear.
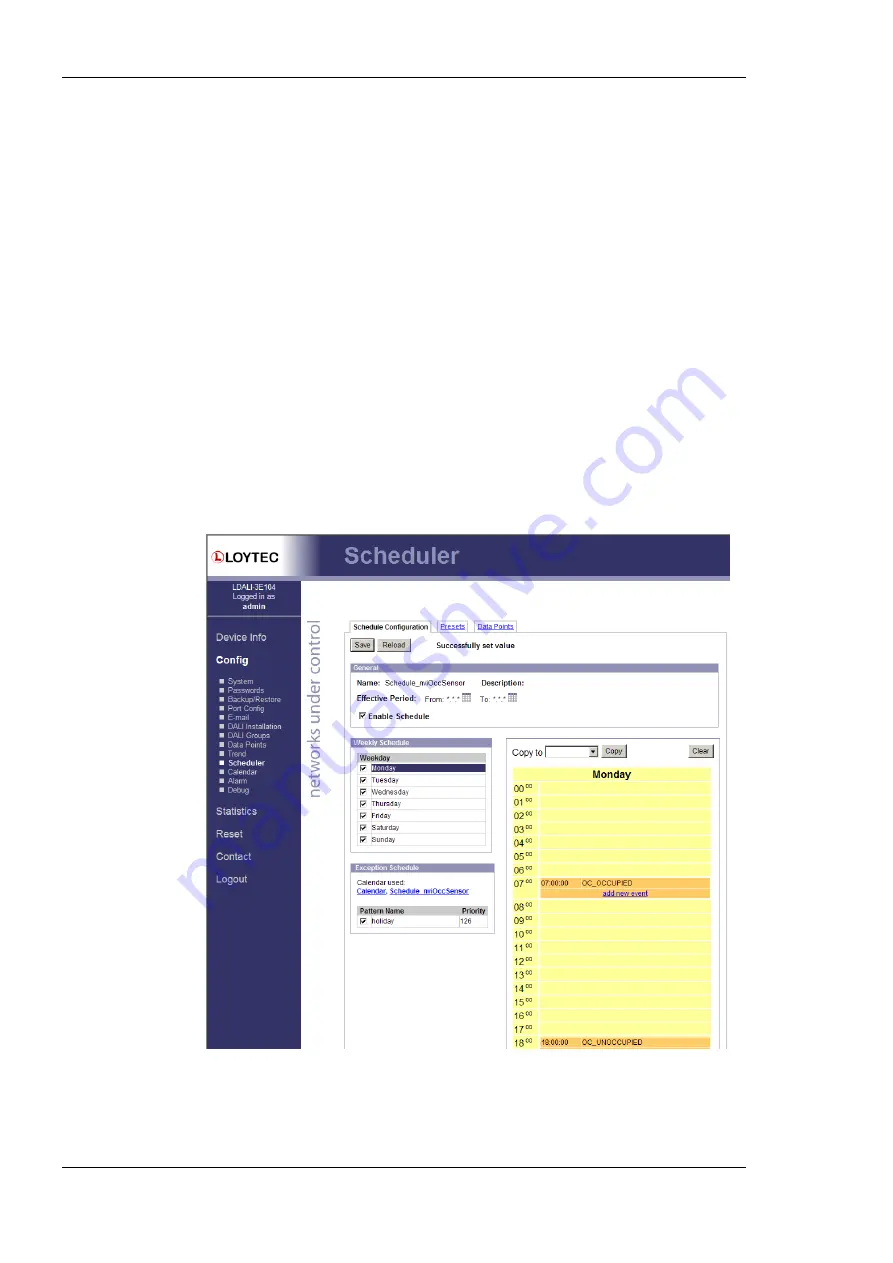
5.4.3 Scheduler
The Web interface provides the scheduler page to edit its schedules at run-time, i.e., change
the times and values that shall be scheduled. Setting up new schedules (configuring
scheduled datapoints etc.) can be done in the configuration software (see Section 7.10) or in
case of the BACnet version using a BACnet Operator Workstation. The scheduler main
page displays all available schedules. Click on the schedule to be edited. This opens the
scheduler page. An example is shown in Figure 91.
Figure 91: Schedule Configuration Page.
The
effective period
defines when this schedule shall be in effect. Leave
From
and
To
at
‘*.*.*’ to make this schedule always in-effect. Otherwise select the desired start and/or end