


8-24
Breaker Monitor and Metering Functions
Date Code 20010625
SEL-311L Instruction Manual
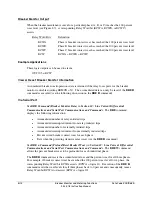
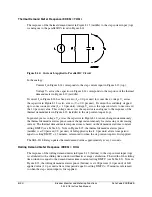
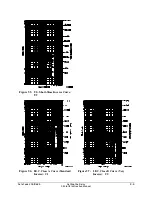
Thermal Demand Meter Response (EDEM = THM)
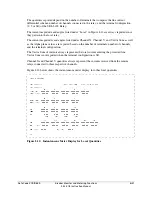
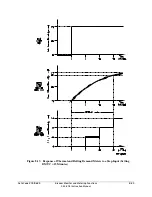
The response of the thermal demand meter in Figure 8.13 (middle) to the step current input (top)
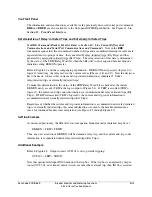
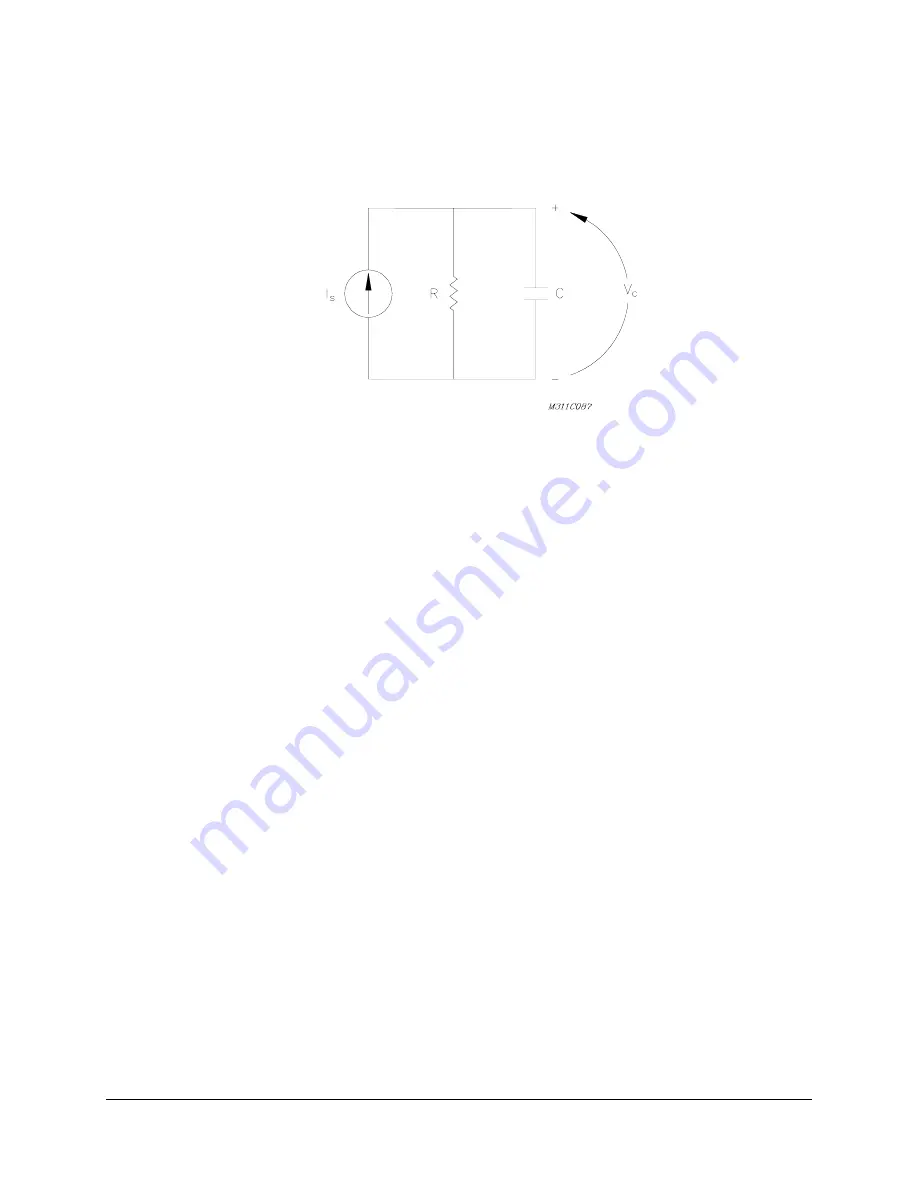
is analogous to the parallel RC circuit in Figure 8.14.
Figure 8.14: Current I
S
Applied to Parallel RC Circuit
In the analogy:
Current I
S
in Figure 8.14 corresponds to the step current input in Figure 8.13 (top).
Voltage V
C
across the capacitor in Figure 8.14 corresponds to the response of the thermal
demand meter in Figure 8.13 (middle).
If current I
S
in Figure 8.14 has been at zero (I
S
= 0.0 per unit) for some time, voltage V
C
across
the capacitor in Figure 8.14 is also at zero (V
C
= 0.0 per unit). If current I
S
is suddenly stepped
up to some constant value (I
S
= 1.0 per unit), voltage V
C
across the capacitor starts to rise toward
the 1.0 per unit value. This voltage rise across the capacitor is analogous to the response of the
thermal demand meter in Figure 8.13 (middle) to the step current input (top).
In general, just as voltage V
C
across the capacitor in Figure 8.14 cannot change instantaneously,
the thermal demand meter response cannot change instantaneously for increasing or decreasing
current. The thermal demand meter response time is based on the demand meter time constant
setting DMTC (see Table 8.3). Note in Figure 8.13, the thermal demand meter response
(middle) is at 90 percent (0.9 per unit) of full applied value (1.0 per unit) after a time period
equal to setting DMTC = 15 minutes, referenced to when the step current input is first applied.
The SEL-311L Relay updates thermal demand values approximately every 2 seconds.
Rolling Demand Meter Response (EDEM = ROL)
The response of the rolling demand meter in Figure 8.13 (bottom) to the step current input (top)
is calculated with a sliding time-window arithmetic average calculation. The width of the sliding
time-window is equal to the demand meter time constant setting DMTC (see Table 8.3). Note in
Figure 8.13, the rolling demand meter response (bottom) is at 100 percent (1.0 per unit) of full
applied value (1.0 per unit) after a time period equal to setting DMTC = 15 minutes, referenced
to when the step current input is first applied.
Summary of Contents for SEL-311L
Page 6: ......
Page 8: ......
Page 26: ......
Page 54: ......
Page 144: ......
Page 216: ......
Page 252: ......
Page 302: ......
Page 338: ......
Page 480: ......
Page 484: ......
Page 486: ......
Page 502: ......
Page 532: ...12 28 Standard Event Reports and SER Date Code 20010625 SEL 311L Instruction Manual 4 ...
Page 552: ......
Page 554: ......
Page 574: ......
Page 576: ......
Page 596: ......
Page 602: ......
Page 628: ......
Page 656: ......
Page 662: ......
Page 664: ......
Page 688: ......
Page 700: ......
Page 716: ......
Page 722: ......
Page 734: ......