Internal Calibrations
Page 8-2
Calibration Data
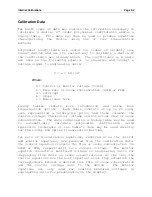
Two basic types of data may contain the information necessary to
calibrate a device: 2
nd
order polynomial coefficients and/or a
lookup table. This data may then be used to produce equations
characterizing the device using one of four linearization
methods.
Polynomial coefficients are useful for linear or slightly non-
linear devices and are the easiest way to calibrate a device if
the coefficients are already known. The coefficients a, b and c
are used in the following equation to linearize and convert a
voltage signal to engineering units:
Y = a + bX +cX
2
Where:
X = Control or monitor voltage (Volts)
Y = Flow rate or ozone concentration (SCCM or PPB)
a = Intercept
b = Slope
c = Non-linear term
Lookup
tables
contain
more
information
and
allow more
linearization options. Each table consists of up to 20 rows,
each representing a calibration point, and three columns: the
control voltage, the monitor voltage and the actual flow or ozone
concentration. The data contained in a lookup table may be used
to
automatically
calculate
polynomial
coefficients
using
regression techniques or the table’s data may be used directly
for the lookup and spline linearization methods.
Two sets of linearization equations, referred to as the control
and monitor equations, are produced from the calibration data.
The control equation converts the flow or ozone concentration (in
SCCM or PPB, respectively) to a control voltage. The monitor
equation converts a monitored voltage to engineering units for
displaying flow rates or ozone concentrations. Of the two, the
control equations are the most important since they establish the
correspondence between a desired flow rate or ozone concentration
and the control voltage sent to the device. The monitor
equations are only used for scaling measured voltages to
engineering units for presentation on the display.
Summary of Contents for 2010D
Page 1: ...MODEL 2010D GAS DILUTION CALIBRATOR OPERATIONS MANUAL I N S T R U M E N T S...
Page 3: ......
Page 20: ...System Operations Page 3 2 Figure 3 1 The Model 2010D Front Panel...
Page 42: ...Installation Page 4 15 Figure 4 1 Rear Panel...
Page 63: ...Operation Page 5 7 Figure 5 5 The Dilution Status Screen Figure 5 6 The Ozone Status Screen...
Page 177: ...MODEL 2010D GAS DILUTION CALIBRATOR SCHEMATICS...
Page 178: ......


