Chapter VIII Display System
64
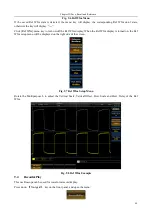
Fig. 8.9 Intensity Menu
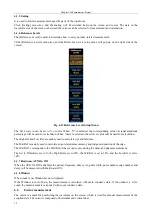
This oscilloscope can be used to set the Wave Intensity, Graticule Intensity and Screen Intensity.
After clicking the menu key, the corresponding Intensity setup menu will pop up, and then rotate the Multipurpose
b to adjust the intensity.
8.6
XY Display
In XY mode, the oscilloscope will convert two input channels to voltage-voltage display from voltage-time
display. The X axis and Y axis will track the voltage of CH1 and CH2 respectively. The phase difference between
two signals with the same frequency can be easily displayed and measured with Lissajous method. The following
figure gives the principle diagram of measurement phase difference.
The signal must be
centered
Fig. 8.10 Principle Diagram of Phase Difference Measurement
According to sinθ=A/B or C/D, where θ is the phase difference angle between the channels, and definitions of A,
B, C, D are as shown in the above figure. Therefore, the phase difference angle can be obtained: θ = ±arcsin (A/B)
or ±arcsin (C/D). If the main axis of the ellipse is in quadrants I and III, the obtained phase difference angle shall
be in quadrants I and IV, namely in (0 ~ π/2) or (3 π/2 ~ 2π). If the main axis of the ellipse is in quadrants II and IV,
the obtained phase difference angle shall be in quadrants II and III, namely in (π/2 ~ π) or (π ~ 3π/2).
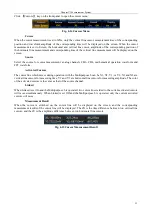
Click [XY Display] key of the display menu to turn on/off XY display.
Attention: When the XY display mode is enabled, if the logic analyzer is enabled, it will automatically disable the
logic analyzer.
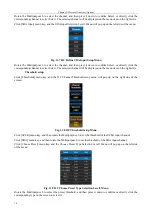
Fig. 8.11 Display Menu
When the XY mode is enabled, the Channel1 and Channel2 are a group, while the Channel3 and Channel4 are a
group. The Channel1 and Channel3 correspond to the data of X axis and the Channel2 and Channel4 correspond
to the data of Y axis.
Summary of Contents for 4456 Series
Page 10: ...VIII...
Page 55: ...Chapter V Trigger System 45 Fig 5 51 RF Test Signal Example...
Page 69: ...Chapter VII Mathematical Operation 59 Fig 7 10 Advanced Math Example...
Page 71: ...Chapter VIII Display System 61 Fig 8 3 Wfm Palette Menu Fig 8 4 Normal Palette...
Page 72: ...Chapter VIII Display System 62 Fig 8 5 Inverted Palette Fig 8 6 Temperature Palette...
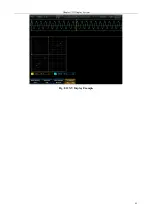
Page 75: ...Chapter VIII Display System 65 Fig 8 12 XY Display Example...
Page 165: ...Chapter XI Protocol Analyzer Option 155 Fig 11 242 1553 Trigger and Analysis Example...


