Chapter XIX Application Examples
230
Chapter XIX Application Examples
19.1
Measuring Simple Signal
There is an unknown signal in the circuit and you need to quickly display and measure the frequency and
amplitude of the signal. Follow the following steps:
1)
Connect the ground wire on the probe to the circuit under test. The needle of the probe touches the measured
point of the circuit.
2)
Press
【
AutoSet
】
key and the oscilloscope will automatically set to display optimal waveforms. On the basis
of this, you may further adjust the vertical and horizontal positions until the waveform display meets your
requirements.
3)
To measure the frequency and amplitude, press the
【
Measure
】
key to display the level 1 menu. Click the
[Add Measurement] menu to pop up the Add Level2 Menu on the right of the screen.
4)
Click [Source] and select the corresponding measurement channels CH1-CH4.
5)
Click [Type] and select the corresponding measurement parameters such as frequency, amplitude and peak.
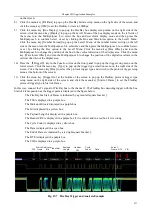
Fig. 19.1 Automatic Measurement Example
19.2
Measuring Pulse Signal
In the circuit there is a pulse signal with the period of 1 kHz, the pulse width of 8 ns and the amplitude of 200 mV.
You can observe the complete signal by following the steps below.
1)
Connect the ground wire on the probe to the circuit under test. The needle of the probe touches the measured
point of the circuit.
2)
Press the
【
Acquire
】
button to display the level 1 menu at the bottom of the screen, click the [Acquisition
Mode] menu to pop up the Level2 Menu on the right side of the screen, and select the [Peak Detect] mode
through the Multipurpose b or the touch screen.
3)
Adjust the Scale knob to change the time base position and adjust the time base to 1ms/div.
4)
Adjust the Scale knob and adjust the vertical sensitivity to 50mV/div.
5)
Press the
【
Trigger
】
key to pop up the trigger main menu, click the [Source] menu, select the corresponding
trigger channel, and adjust the trigger level knob to display the waveform stably.
6)
You can observe a stable pulse signal.
Summary of Contents for 4456 Series
Page 10: ...VIII...
Page 55: ...Chapter V Trigger System 45 Fig 5 51 RF Test Signal Example...
Page 69: ...Chapter VII Mathematical Operation 59 Fig 7 10 Advanced Math Example...
Page 71: ...Chapter VIII Display System 61 Fig 8 3 Wfm Palette Menu Fig 8 4 Normal Palette...
Page 72: ...Chapter VIII Display System 62 Fig 8 5 Inverted Palette Fig 8 6 Temperature Palette...
Page 75: ...Chapter VIII Display System 65 Fig 8 12 XY Display Example...
Page 165: ...Chapter XI Protocol Analyzer Option 155 Fig 11 242 1553 Trigger and Analysis Example...

