


d.
Press
4
Meas
5,
NNNNN
R
to
set
the
4395A
to
the
R
input.
e.
P
erform
the
follo
wing
steps
to
test
the
absolute
amplitude
accuracy
at
the
R
input.
i.
Press
4
Center
5,
4
1
5,
4
0
5,
4
0
5,
4
x1
5
to
set
the
4395A
cen
ter
frequency
to
the
rst
test
frequency
100
kHz
listed
in
T
able
2-12.
T
able
2-12
lists
test
frequencies.
ii.
Press
4
Bw/Avg
5,
NNNNNNNNNNNNNNNNN
IF
BW
,
4
1
5,
4
0
5,
4
x1
5
to
set
the
4395A
IF
Bandwidth
to
the
rst
test
IF
Bandwidth
10
Hz
listed
in
T
able
2-12.
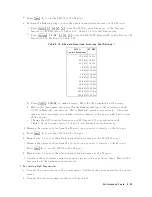
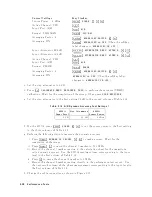
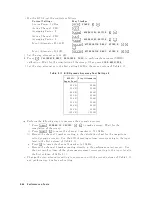
T
able
2-12.
Absolute
Amplitude
Accuracy
T
est
Settings
1
4395A
Cen
ter
F
requency
IF
BW
100
Hz
10
Hz
200
Hz
10
Hz
500
Hz
10
Hz
1
kHz
100
Hz
2
kHz
100
Hz
5
kHz
100
Hz
10
kHz
100
Hz
20
kHz
100
Hz
50
kHz
100
Hz
100
kHz
100
Hz
200
kHz
100
Hz
500
kHz
100
Hz
iii.
Press
4
T
rigger
5,
NNNNNNNNNNNNNNNNNNNN
SINGLE
to
make
a
sw
eep.
W
ait
for
the
completion
of
the
sw
eep.
iv.
Record
the
trace
mean
v
alue
and
the
m
ultimeter
reading
in
the
calculation
sheet
(\4395A
Reading"
column
and
\Meter
Reading"
column,
resp ectiv
ely).
The
trace
mean
v
alue
is
display
ed
as
a
marker
statistic
(mean)
in
the
upp er
right-hand
corner
of
the
display
.
v.
Change
the
4395A
cen
ter
frequency
and
IF
Bandwidth
in
accordance
with
T
able
2-12,
and
rep eat
steps
1-e-iii
and
1-e-iv
for
eac
h
cen
ter
frequency
.
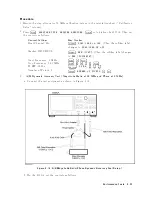
f.
Remo
v
e
the
p o
w
er
splitter
from
the
R
input,
and
connect
it
directly
to
the
A
input.
g.
Press
4
Meas
5,
NNNNN
A
to
set
the
4395A
to
the
A
input.
h.
Repeat
step
1-e
to
test
the
absolute
amplitude
accuracy
at
the
4395A
A
input.
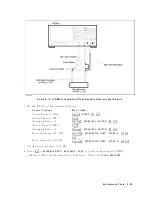
i.
Remo
v
e
the
p o
w
er
splitter
from
the
A
input,
and
connect
it
directly
to
the
B
input.
j.
Press
4
Meas
5
NNNNN
B
to
set
the
4395A
to
the
B
input.
k.
Repeat
step
1-e
to
test
the
absolute
amplitude
accuracy
at
the
B
input.
l.
Calculate
the
test
results
using
the
equation
given
in
the
calculation
sheet.
Record
the
test
results
in
the
p erformance
test
record.
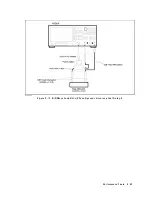
2.
F
or
testing
high
frequencies
a.
Connect
the
p o
w
er
sensor
to
the
p o
w
er
meter.
Calibrate
the
p o
w
er
meter
for
the
p o
w
er
sensor.
b.
Connect
the
test
equipmen
t
as
sho
wn
in
Figure
2-13 .
P
erformance
T
ests
2-33
Summary of Contents for 4395A
Page 10: ......
Page 26: ......
Page 34: ......
Page 77: ...Figure 2 17 B R Magnitude Ratio Phase Dynamic Accuracy Test Setup 2 Performance Tests 2 43 ...
Page 167: ...Figure 5 1 Adjustment Hardware Setup Adjustments 5 5 ...
Page 186: ...Figure 5 13 Receiver Gain Adjustment Location 5 24 Adjustments ...
Page 190: ...Figure 5 16 Receiver Flatness Adjustment Setup 1 MHz 5 28 Adjustments ...
Page 194: ...Figure 5 20 DC Bias Adjustment Setup 2 5 32 Adjustments ...
Page 196: ...Figure 6 1 Troubleshooting Organization 6 2 Troubleshooting ...
Page 206: ...Figure 7 1 Power Supply Lines Simplified Block Diagram 7 2 Power Supply Troubleshooting ...
Page 212: ...Figure 7 5 A1 CPU Connector Locations 7 8 Power Supply Troubleshooting ...
Page 220: ...Figure 8 1 Digital Control Group Simplified Block Diagram 8 2 Digital Control Troubleshooting ...
Page 240: ...Figure 10 1 Top View Major Assemblies 10 4 Replaceable Parts ...
Page 292: ...Table A 2 Manual Changes by Firmware Version Version Make Manual Changes A 2 Manual Changes ...
Page 308: ......
Page 311: ...Figure B 1 Power Cable Supplied Power Requirement B 3 ...
Page 312: ......
Page 342: ......


