


ix.
Set
the
8566A/B
cen
ter
frequency
to
the
third
harmonics
frequency
listed
in
the
third
column
of
T
able
2-6 .
x.
Press
4
SINGLE
5
to
make
a
sw
eep.
W
ait
for
the
completion
of
the
sw
eep.
xi.
Press
4
PEAK
SEARCH
5
to
mov
e
the
marker
to
the
p eak
of
the
third
harmonic.
xii.
Record
the
delta
marker
reading
in
the
calculation
sheet
(\Delta
Marker
Reading"
column).
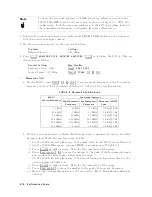
c.
Change
the
measuremen
t
setting
in
accordance
with
T
able
2-6
and
rep eat
step
5-b
for
eac
h
frequency
.
d.
Calculate
test
results
using
the
equation
given
in
the
calculation
sheet.
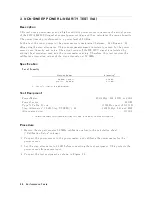
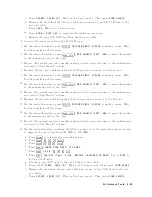
6.
|Non-Harmonic
Spurious
T
est|
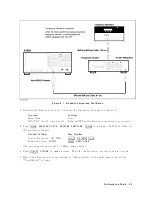
a.
On
the
sp ectrum
analyzer,
set
the
con
trols
as
follo ws:
Con
trols
Settings
Reference
Lev
el
+20
dBm
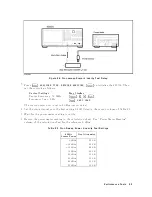
b.
On
the
4395A,
press
4
Center
5,
4
1
5,
4
0
5,
4
x1
5
to
set
the
cen
ter
frequency
to
the
rst
cen
ter
frequency
listed
in
the
rst
column
of
T
able
2-7 .
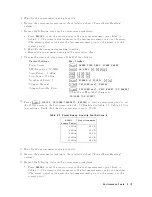
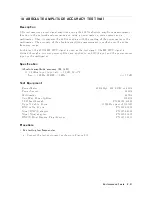
T
able
2-7
lists
test
frequencies.
T
able
2-7.
Non-Harmonics
T
est
Settings
4395A
Cen
ter
F
requency
Sp ectrum
Analyzer
Non-Harmonics
Spurious
F
requency
RBW
F
requency
Span
10
Hz
830.00001
MHz
10
Hz
10
Hz
230
MHz
600
MHz
1
kHz
30
Hz
330
MHz
500
MHz
1
kHz
30
Hz
430
MHz
400
MHz
1
kHz
30
Hz
500
MHz
330
MHz
1
kHz
30
Hz
c.
On
the
sp ectrum
analyzer,
p erform
the
following
steps
to
measure
the
non-harmonic
spurious
lev
el
of
the
rst
test
frequency
10
Hz.
d.
P
erform
the
follo
wing
steps
to
test
non-harmonics
spurious
of
4395A.
i.
Set
the
8566A/B
cen
ter
frequency
to
the
same
v
alue
as
the
4395A
cen
ter
frequency
.
ii.
Set
the
8566A/B
frequency
span
and
RBW
in
accordance
with
T
able
2-7.
iii.
Press
4
SINGLE
5
to
make
a
sw
eep.
W
ait
for
the
completion
of
the
sw
eep.
iv.
Press
4
PEAK
SEARCH
5,
4
1
5
to
mov
e
the
marker
to
the
p eak
of
the
fundamen
tal
signal
and
to
place
the
delta
maker
reference
at
the
p eak.
v.
Set
the
8566A/B
cen
ter
frequency
to
the
frequency
listed
in
the
second
column
of
T
able
2-7.
vi.
Press
4
SINGLE
5
to
make
a
sw
eep.
W
ait
for
the
completion
of
the
sw
eep.
vii.
Press
4
PEAK
SEARCH
5
to
mov
e
the
marker
to
the
p eak
of
the
non-harmonic
spurious.
viii.
Record
the
delta
marker
reading
in
the
calculation
sheet
(\Delta
Marker
Reading"
column).
e.
Change
the
measuremen
t
setting
in
accordance
with
T
able
2-7
and
rep eat
step
6-d
for
eac
h
frequency
.
f.
Calculate
test
results
using
the
equation
given
in
the
calculation
sheet.
P
erformance
T
ests
2-17
Summary of Contents for 4395A
Page 10: ......
Page 26: ......
Page 34: ......
Page 77: ...Figure 2 17 B R Magnitude Ratio Phase Dynamic Accuracy Test Setup 2 Performance Tests 2 43 ...
Page 167: ...Figure 5 1 Adjustment Hardware Setup Adjustments 5 5 ...
Page 186: ...Figure 5 13 Receiver Gain Adjustment Location 5 24 Adjustments ...
Page 190: ...Figure 5 16 Receiver Flatness Adjustment Setup 1 MHz 5 28 Adjustments ...
Page 194: ...Figure 5 20 DC Bias Adjustment Setup 2 5 32 Adjustments ...
Page 196: ...Figure 6 1 Troubleshooting Organization 6 2 Troubleshooting ...
Page 206: ...Figure 7 1 Power Supply Lines Simplified Block Diagram 7 2 Power Supply Troubleshooting ...
Page 212: ...Figure 7 5 A1 CPU Connector Locations 7 8 Power Supply Troubleshooting ...
Page 220: ...Figure 8 1 Digital Control Group Simplified Block Diagram 8 2 Digital Control Troubleshooting ...
Page 240: ...Figure 10 1 Top View Major Assemblies 10 4 Replaceable Parts ...
Page 292: ...Table A 2 Manual Changes by Firmware Version Version Make Manual Changes A 2 Manual Changes ...
Page 308: ......
Page 311: ...Figure B 1 Power Cable Supplied Power Requirement B 3 ...
Page 312: ......
Page 342: ......


