PLC WorkShop for Simatic TI505
FTTrend
••••
9
[Month]/[day]/[year] -
each represented by 2 digits.
[month] /[day
– each represented by 2 digits. The default format is
(
[month]/[day]/[year] -
each represented by 2 digits).
If neither is checked then nothing is display along the X-axis.
“
Use Start Times
” or “
Use Start Date
" allow
you to set a time range to
view logged data. If Use Start Time or Use Start Date is not checked then
data will be read from the server or database and plotted immediately
provided that the trend window is online and active. If Use Start Time or
Use Start Date is checked then data will be read from the server or
database and plotted after the time indicated in the selection box.
“
Date Highlight Colors
" changes the color for the date display on the x-axis.
For clarity sack, days are alternated up and down on the x-axis. The first day is
positioned up, the second day down and to the right, third day up and to the right
etc. Color1 represents the up day and Color2 the down day.
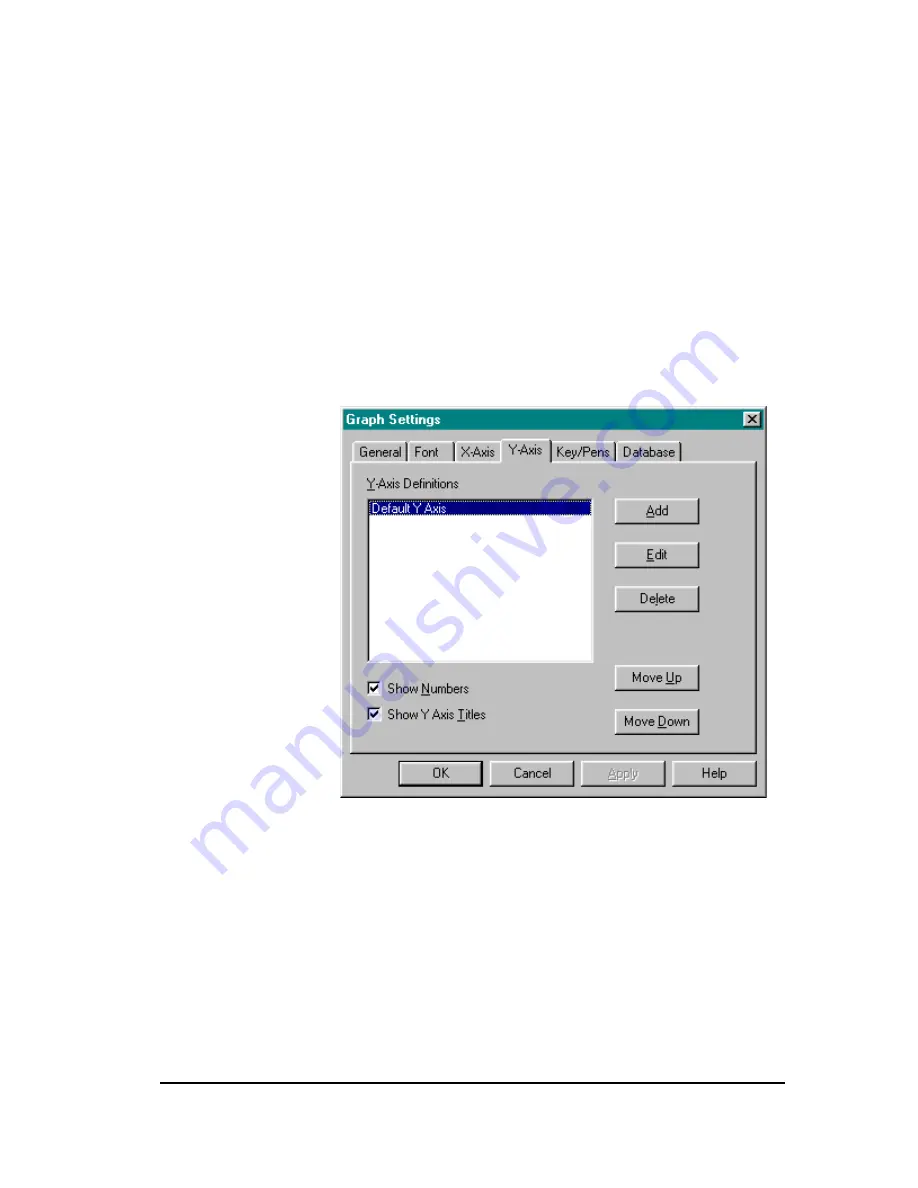
Y-Axis Tab
Y-axis Tab is where settings for the Y-axis are set (figure 12).
Figure 12
There can be up to 16 different y-axis per trend graph. To add additional
y-axis charts select the Add button and enter an y-axis title, the high and
low ranges of the data to chart (figure 13). The high value must be
greater than the low value. If Auto Number is checked FTTrender will
automatically scale the y-axis. If it is not selected, then a number count
must be entered to scale the axis.
A limit marker can also be added to the graph. The limit marker gives a
visual reference to a selected data point across the y-axis. The limit
marker must be greater than or equal to the low Data Range and less than
or equal to the high Data Range. It also must have a tag description
associated with it. It's line thickness and color can be changed as well.
If there are multiple y-axis plotted there order of appearance from top to
bottom can be changed by using the Move Up and Move Down button on


