6100-Gfast Multifunction Copper Tester Operation Manual
© 2020 Radiodetection Ltd
111
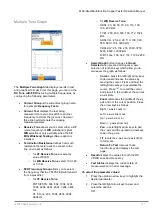
Select Graph
button changes to
Graph
Selected
when pressed and opens a new
selection of function keys which allow you to
maneuver the graph as follows:
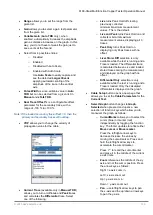
o
Cursor
- press the left/right arrow keys
to decrease/increase the values by
moving the cursor. Press and hold the
left/right arrow keys to accelerate the
cursor. Press
to recall the cursor
and place it in the middle of the current
x-axis limits.
o
Zoom
references the middle of the x/y
axis and not the cursor position. Press
the arrow keys as follows:
Right = x-axis zoom in.
Left = x-axis zoom out.
Up = y-axis zoom in.
Down = y-axis zoom out.
o
Pan
- use left/right arrow keys to pan
the x-axis and the up/down arrow keys
to pan the y-axis.
o
1:1
resets the x-axis and y-axis limits
to full scale.
o
Return To Results
removes these
function keys and displays the
Attenuation
results page.
When Mask was enabled for the selected
bandwidth:
The end of tolerance or fail point may be
displayed as a red cursor value.
Good
is the good balance threshold mask for
the currently selected bandwidth, represented
by green in the graph.
Result Details Cable Configuration
The
Cable Configuration
page in the
Results Details
allows you to view the cable parameters set for the
WB
Attenuation
test.
No. of Cable Sections
is the number of
consecutive cable sections, with a maximum of
4.
Cable Type #
displays the number of a cable
section set above, ID, Cable Name and Fill.
Section Length
identifies the cable length of
each section.
12.5 Return Loss
The Return Loss test allows you to measure the loss of
power in the signal returned/reflected by a discontinuity
in a transmission line. This discontinuity or impedance
variation can be a mismatch with the terminating load
or with a device inserted in the line.
A small value dBRL number means that most of the
pulse energy is reflected by the cable fault. An open or
short would reflect all the energy so its return loss is
zero.
Remember, the larger the dBRL reading, the smaller
the problem and vice versa.
Single Frequency
The
Single Frequency
test is continuous, and allows
you to configure parameters and change values during
the measurement. The page provides a
Return Loss
result value in dB, and pass/fail status.


