background image

Contact Mode Imaging

5

Keysight 5500 SPM User’s Guide

5-4

11

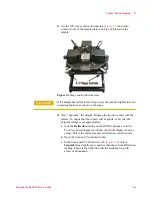
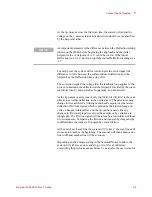
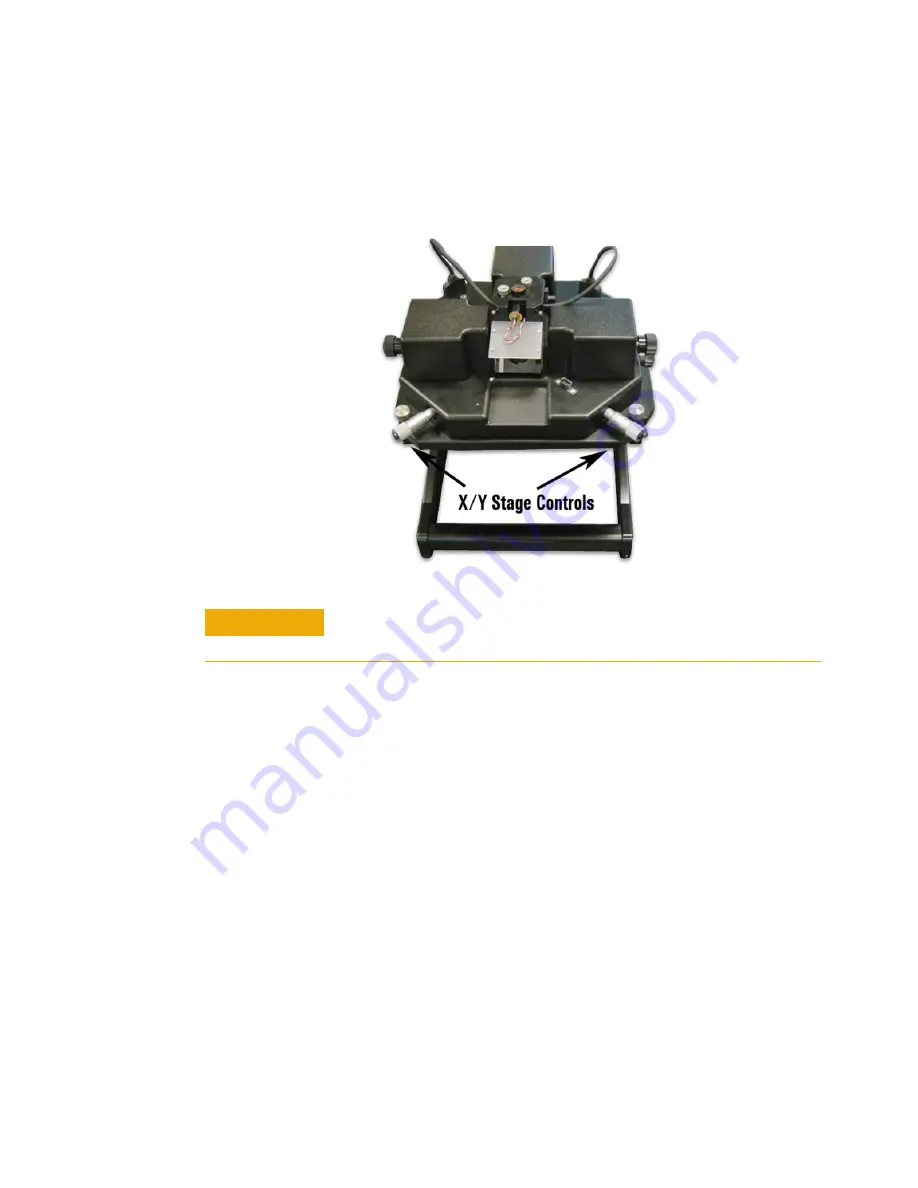
Use the X/Y stage control micrometers (

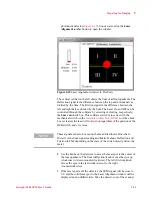
Figure 5-3

) and video 

window to move the sample plate to an area of interest on the 
sample.

Figure 5-3 

Stage control micrometers

12

Next, “approach” the sample, bringing the tip into contact with the 
surface. To ensure that the contact will be gentle, verify that the 
Setpoint voltage is set appropriately:

a

Note the 

Deflection

 reading on the HEB front panel, or in the 

PicoView Laser Alignment window (both will display the same 
value). This is the current cantilever deflection, stated in volts.

b

Open the Scan and Z controls window.

c

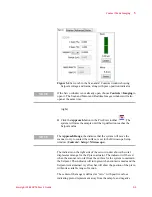
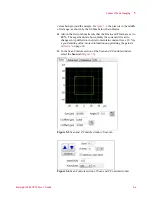
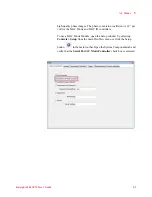
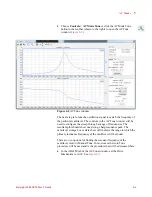
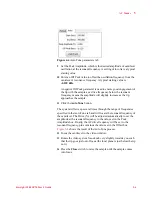
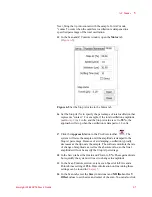
In the Scan and Z Controls Servo tab (

Figure 5-4

), enter a 

Setpoint

 value slightly more positive than the current Deflection 

reading. This sets the deflection that the feedback loop will 
achieve and maintain. 

CAUTION

If the sample has tall features or steps, raise the scanner slightly to avoid 
contacting features as you move the stage. 

Summary of Contents for 5500

Page 1: ...Keysight 5500 Scanning Probe Microscope User s Guide ...

Page 2: ......

Page 3: ... furnished under a license and may be used or copied only in accordance with the terms of such license Restricted Rights Legend If software is for use in the performance of a U S Government prime contract or subcontract Software is delivered and licensed as Commercial computer soft ware as defined in DFAR 252 227 7014 June 1995 or as a commercial item as defined in FAR 2 101 a or as Restricted com...

Page 4: ... such defects during the warranty period Keysight will replace software media which does not execute its programming instructions due to such defects For detailed warranty information see back matter Safety Considerations General This product and related documentation must be reviewed for familiarization with these safety markings and instructions before operation This product is a safety Class I ...

Page 5: ...nstallation Category II This equipment is for indoor use only When the product is subjected to 8 kV air discharge or 4 kV contact discharge in accordance with IEC 61000 4 2 interruption of the laser output may occur If this happens laser power must be re cycled in order to resume normal operation CAUT NOTE These specifications apply to the Keysight 5500 system and do not guarantee the function of ...

Page 6: ... into the laser beam To ensure safe operation the scanner must be operated and maintained in accordance with the instructions included with the laser The laser must only be powered by a controller that includes an on off switch such as the Keysight SPM Controller DO NOT attempt to make any adjustments to the laser the laser s electronics or optics If laser malfunction is suspected immediately retu...

Page 7: ...ltage switch with the desired voltage 5 Replace the fuse holder Piezo Scanner Precautions Piezo scanners are by nature very FRAGILE pieces of equipment The piezo material that does the scanning is a ceramic and is consequently quite easily broken Dropping a piezo scanner will result in damage to the scanner that can only be repaired by completely replacing the scanner piezo core This can be an exp...

Page 8: ...storage Cleaning can be done using an organic solvent Please refer to the appropriate sections of the manual for further information regarding the proper cleaning of equipment Disclaimers This User s Guide as well as the hardware herein described is licensed and can only be used in compliance with such terms and agreements as entered in by Keysight Technologies Users of these products understand e...

Page 9: ...Read This First N9410 90001 Keysight 5500 SPM User s Guide ix Declaration of Conformity ...

Page 10: ...00 Fax 1 480 756 5950 E mail AFM info keysight com Web www keysight com Customer Technical Support Tel 1 480 756 5900 Fax 1 480 756 5950 E mail AFM Support keysight com Technical Sales Tel 1 480 756 5900 Fax 1 480 756 5950 E mail AFM info keysight com Distributors and Account Representatives Please visit our web site for up to date information www keysight com find nano ...

Page 11: ... I x II Table of Contents 1 Introduction to the Keysight 5500 Overview of Keysight SPM System 1 2 SPM Basics 1 3 SPM Techniques 1 5 Scanning Tunneling Microscopy STM 1 5 Atomic Force Microscopy AFM 1 6 Contact Mode AFM 1 8 Intermittent Contact AFM 1 9 Current Sensing Mode CSAFM 1 12 Force Modulation Microscopy FMM 1 13 Lateral Force Microscopy LFM 1 14 Dynamic Lateral Force Microscopy DLFM 1 14 Ma...

Page 12: ... 15 Breakout Box 2 16 Vibration Isolation Chamber 2 21 Software 2 22 System Options 2 23 MAC Mode 2 23 MAC III Mode 2 23 Liquid Cell 2 23 Temperature Control 2 24 Thermal K 2 24 Environmental Chamber 2 24 Glove Box 2 25 Electrochemistry 2 26 PicoTREC 2 26 PicoLITH 2 26 3 Setting Up the Keysight 5500 SPM Component and Facility Dimensions 3 1 Facility Requirements 3 4 Utilities 3 5 Noise and Facilit...

Page 13: ...e Nose Assembly 4 2 Two Piece Nose Assembly 4 9 Inserting the Scanner and Connecting Cables 4 12 Aligning the Laser 4 14 Inserting and Aligning the Detector 4 22 Mounting the Sample 4 26 Using the Video System 4 29 5 Contact Mode Imaging Setting Up for Contact Mode Imaging 5 2 Constant Force Mode 5 2 Constant Height Mode 5 9 Fine Tuning the Image 5 9 6 AC Modes Acoustic AC Mode AAC 6 3 AAC Mode 6 ...

Page 14: ...KFM 7 29 Force Spectroscopy 7 31 Force Spectroscopy Procedure for Contact Mode 7 32 FlexGrid Spectroscopy 7 36 FlexGrid Spectroscopy Procedure for Contact Mode 7 36 Volume Spectroscopy 7 41 Volume Spectroscopy Procedure for Contact Mode 7 41 8 Scanner Maintenance and Calibration Care and Handling of the Probes and Scanner 8 3 Probes 8 3 Nose Assembly 8 3 Scanner 8 4 Scanner Characteristics 8 4 Non...

Page 15: ...up 10 4 11 MAC III Initial Setup 11 2 List of MAC III Components 11 2 Hardware and Sample Setup 11 6 Auxiliary Signal Access Box 11 6 MAC III Software Controls 11 11 Simplified Software Control Options 11 12 Advanced Software Control Options 11 24 Amplitude and Frequency Modulation Techniques 11 33 Setting Parameters for AM Mode Operation 11 36 Setting Parameters for FM Mode Operation 11 40 Piezor...

Page 16: ...erature Controlled Imaging 13 22 14 Thermal K Thermal K Calibration 14 3 Thermal K Setup 14 3 Spring Constant Calibration 14 4 15 Environmental Control Environmental Chamber 15 1 Glove Box 15 3 16 Electrochemistry Equipment 16 3 Liquid Cell 16 3 Electrodes 16 3 Cleaning 16 5 Liquid Cell Cleaning 16 5 Electrode Cleaning 16 6 Sample Plate Cleaning 16 6 Substrate Cleaning 16 6 Assembling and Loading ...

Page 17: ...16 12 Assembling the SECM Nose Cone 16 14 SECM Software Interface 16 17 A Wiring Diagrams Keysight 5500 SPM Standard Wiring Diagram A 2 Keysight 5500 SPM with MAC Mode Controller A 3 Keysight 5500 SPM with MAC Mode Force Modulation Imaging A 4 Keysight 5500 SPM with MAC III Option A 5 Keysight 5500 SPM with MAC III Option and Closed Loop Scanner A 6 Index ...

Page 18: ... Electrostatic Force Microscopy EFM 1 15 Kelvin Force Microscopy KFM 1 15 The Keysight 5500 SPM is the ideal multiple user research system for Scanning Probe Microscopy SPM As the high performance Atomic Force Microscope AFM flagship of Keysight s product line the 5500 SPM provides a wealth of unique technological features including precision temperature control and industry leading environmental ...

Page 19: ...ed computer AFM controller and Head Electronics Box Optional components include additional electronics specialized scanners and probes for particular SPM techniques and an environmental enclosure to control acoustic and vibration noise Figure 1 1 The Keysight 5500 SPM microscope shown with optional environmental chamber In this User s Guide we will begin with a brief introduction to Scanning Probe...

Page 20: ...ters high In SPM techniques the sharp probe tip is scanned across a sample surface or the surface is scanned beneath the tip Figure 1 2 Interactions between the tip and sample are detected and mapped Different techniques sense different interactions which can be used to describe surface topography adhesion elasticity electrostatic charge etc Figure 1 2 Scanning Probe Microscopy diagram The small s...

Page 21: ... image of the same sample area This helps reveal any correlation between topography and the interaction In some instances the signal from the SPM s detector is mapped directly for example the deflection of the probe cantilever or the current through a metal tip In other instances the signal from the detector serves as the input of a feedback system which attempts to maintain the detector signal at...

Page 22: ...TM schematic is shown in Figure 1 3 Figure 1 3 Basic STM schematic STM can image a sample surface in either constant current or constant height mode as described in Figure 1 4 In constant height mode the tip remains in a constant plane above the sample and the tunneling current varies depending on topography and local surface properties The tunneling current measured at each location constitutes t...

Page 23: ...tures as small as an atomic lattice for either conductive or non conductive samples AFM provides high resolution and three dimensional information with little sample preparation The technique makes it possible to image in situ in fluid under controlled temperature and in other controlled environments The potential of AFM extends to applications in life science materials science electrochemistry po...

Page 24: ...ve the tip and sample are separated by large distance As they approach tip and sample atoms first weakly attract each other This zone of interaction is known as the non contact regime Closer still in the intermittent contact regime the repulsive van der Waals force predominates When the distance between tip and sample is just a few angstroms the forces balance and the net force drops to zero When ...

Page 25: ...long as the tip is in contact with the sample the capillary force should be constant because the fluid between the tip and the sample is virtually incompressible The total force that the tip exerts on the sample is the sum of the capillary adhesive and van der Waals forces The van der Waals force counters almost any force that attempts to push the atoms closer together When the cantilever pushes t...

Page 26: ...to the sample constant as well The output of the feedback circuit is used to generate the topography image Constant force mode is more typically used than constant height mode as it enables imaging of greater surface height variability The speed of scanning is limited by the response time of the feedback circuit however The resolution is lower than constant height mode as well due to inherent nois...

Page 27: ...he topography image The topography image is the voltage applied to the piezo required to keep the oscillation amplitude constant multiplied by the sensitivity of the piezo in nanometers volt AC Mode can operate in either the intermittent contact net repulsive regime or the non contact net attractive regime During intermittent contact the tip is brought close to the sample so that it lightly contac...

Page 28: ... the back side of the cantilever is coated with magnetic material A solenoid applies an AC magnetic field which is used to oscillate the cantilever Figure 1 8 MAC Mode is typically cleaner and gentler than Acoustic AC Mode and is free from spurious background signals that are somewhat common when AAC Mode The benefits are particularly pronounced when imaging in liquid NOTE Acoustic AC Mode is an o...

Page 29: ...for large samples or for samples which tend to dissipate the magnetic field enough to affect the resolution of regular MAC Mode Current Sensing Mode CSAFM Current Sensing AFM CSAFM uses standard AFM Contact Mode including a special nose cone containing a pre amp along with an ultra sharp AFM cantilever coated with a conducting film to probe the conductivity and topography of the sample By applying...

Page 30: ...dulation Microscopy FMM In Force Modulation Mode FMM the AFM tip is scanned in contact with the sample As in Contact Mode a feedback loop is used to maintain a constant cantilever deflection and an additional periodic vertical oscillation applied to the tip The amplitude and phase of cantilever modulation resulting from the cantilever s interaction with the sample varies according to the elastic p...

Page 31: ...affect the friction signal To differentiate between friction and topography two images are typically captured side by side One is constructed from the detector signal during the trace left to right tip motion of each line in the raster scan and the other is mapped during retrace right to left tip motion Then one of the two images is inverted and subtracted from the other This reduces the topograph...

Page 32: ...atic field of a sample surface A voltage bias is applied between the tip and the sample allowing local static charge domains and charge carrier density to be measured The system detects changes in the phase response of the cantilever which are induced by the interaction of the conducting tip and the electrostatic field of the sample surface EFM images are usually obtained by monitoring the phase c...

Page 33: ... The output from this feedback loop provides a quantitative analysis of changes in the applied or intrinsic electrostatic field of the sample As in EFM mode KFM uses a conductive tip and either standard AAC or MAC Modes NOTE KFM is an option for the 5500 SPM and requires the additional MAC III controller ...

Page 34: ...er 2 7 Detector 2 9 Sample Plates 2 10 Video System 2 12 Head Electronics Box HEB 2 13 AFM Controller 2 15 Breakout Box 2 16 Vibration Isolation Chamber 2 21 Software 2 22 System Options 2 23 MAC Mode 2 23 MAC III Mode 2 23 Liquid Cell 2 23 Temperature Control 2 24 Thermal K 2 24 Environmental Chamber 2 24 Glove Box 2 25 Electrochemistry 2 26 PicoTREC 2 26 PicoLITH 2 26 ...

Page 35: ...Keysight 5500 SPM Components 5 Keysight 5500 SPM User s Guide 5 2 The major components for the Keysight 5500 SPM are shown in Figure 2 1 Figure 2 1 Components of the Keysight 5500 SPM ...

Page 36: ...Figure 2 2 includes the hinged support stand coarse z axis motors manual X Y positioning micrometers magnetic supports for the sample plates and interconnections for all electronics The support stand is hinged to allow easy access to the sample plate area Figure 2 2 5500 SPM with support stand ...

Page 37: ... cantilever resonance frequencies will vary depending on application type of sample surface imaging environment and type of image being generated Tip geometry may be tetrahedral pyramidal or conical Tip sharpness defined by radius of curvature and sidewall angles greatly affects the resolution available with the probe Common cantilever shapes are triangular V shaped and rectangular beam shaped Can...

Page 38: ...odes and may include additional electronics and or components For example the Top MAC nose assembly includes a coil that provides an oscillating magnetic field Additionally nose assemblies are designed to hold the probe at either nine degrees or eight degrees from horizontal Nine degree nose assemblies are used for general purpose imaging Nine and eight degree nose assemblies may be used for imagi...

Page 39: ...mplify the process of inserting a cantilever It also helps prevent damage to the scanner during installation of the nose assembly Currently the two piece nose assembly is only available for AC Mode Contact Mode imaging Figure 2 4 Two piece nose cone with removal tool and assembly fixture CAUTION The two piece nose assembly cannot be used for imaging in liquid ...

Page 40: ...les contain the piezo elements the socket for the nose assembly mounting for the detector and interconnections The scanners are considered multi purpose because nose assemblies can be switched in and out of the scanner for different imaging modes or environments Figure 2 5 A type Scanner Module Keysight SPMs use two types of scanners A and B A type scanners are most typically used with the Keysigh...

Page 41: ...on imaging The large multi purpose scanner includes four piezo elements for X and Y and provides scans up to 90 microns square There is a larger two element staked piezo tube to provide a larger Z range of motion The scanner provides high resolution and speed for general use applications The large multi purpose scanner is also available with closed loop positioning in which ultra precise positioni...

Page 42: ... side halves measure the twist of the cantilever the Friction signal for lateral force imaging The detector is held in the scanner by magnets on the detector housing and in the scanner Two thumbwheels enable alignment of the detector in both directions There are also four DIP switches to enable or disable the gain of the signal from the detector Enabling the gain is useful when using very non refl...

Page 43: ...icro environments for imaging Figure 2 7 The standard sample plate has a magnetic core that will securely hold samples mounted on magnetic backings Other plates are available for measurement in liquid temperature controlled imaging for MAC and other applications More information for imaging in liquid is in Chapter 12 Liquid Cell Figure 2 7 Three sample plates MAC Mode with heating liquid imaging a...

Page 44: ...User s Guide 5 11 The microscope stand is equipped with three magnetic posts from which a sample plate is mounted Figure 2 8 Micrometers enable manual X Y positioning with total travel of approximately 5 mm Figure 2 8 Sample plate on microscope stand ...

Page 45: ...s the location of regions of interest and align the laser on the probe tip It includes a camera and optics on an adjustable stand Figure 2 9 along with a separate illumination source Figure 2 10 A USB cable connects the camera to the computer Figure 2 9 Video system Figure 2 10 Video system light source ...

Page 46: ...play the Sum signal sum of all four quadrants and the Deflection or Friction signals Meter A upper left is the Sum signal reading and Meter B upper right shows Deflection or Friction LFM depending on the state of the switch directly below the meter The Open Close switch is used to move the sample and tip further apart Open or closer together Close Figure 2 11 Head Electronics Box ...

Page 47: ...Keysight 5500 SPM Components 5 Keysight 5500 SPM User s Guide 5 14 The HEB back panel connections are shown in Figure 2 12 Figure 2 12 HEB back panel connectors and controls ...

Page 48: ...scanning control and extra data channels required for modes such as EFM and KFM Figure 2 13 AFM Controller Model N9610A The Aux In BNC input is added on to the current signal which is used in STM and CSAFM The External Input BNC to the Z piezo is limited to 10 V and the input is scaled up by the controller to 215 V The External Sync BNC is a signal that is sent each time a frame line or pixel is c...

Page 49: ... versions of PicoView Breakout Box There is an optional breakout box N9447A to access various signals associated with the operation of the SPM This box is shown in Figure 2 14 and described in Table 1 Breakout Box Connections must be made properly and are shown in Figure 2 15 on page 20 Figure 2 14 Breakout box for AFM controller ...

Page 50: ...n the AC Mode controller and the AFM controller and AC Mode is On then the signal will be the Phase signal from the AC Mode controller This input has a range of 10 V VEC This is the potential signal from the PicoStat Potentiostat board if the microscope has the electrochemistry option If there is no electrochemistry option this is a floating input into the AFM controller and can be used as an auxi...

Page 51: ...ignal has a range of 10 V and is a 24 bit DAC output 5 V This is the 5 V power supply output from the controller 15 V This is the 15 V power supply output from the controller 15 V This is the 15 V power supply output from the controller Force Setpoint This signal is an output from the controller and is the Force Setpoint DAC output This signal has a range of 10 V and is a 24 bit DAC output This si...

Page 52: ... front panel of the AFM controller Connect the other end of the cable to the N9744A connector labeled Controller Connect one end of a second DB 44 cable included with the breakout box to the N9744A connector labeled Microscope Connect the other end of the second cable to the connector labeled Controller on the first microscope component in the series configuration For example this could be a MAC o...

Page 53: ...onents 5 Keysight 5500 SPM User s Guide 5 20 connector on the side of the breakout box Connect the other end of the second cable to the 9 pin connector on the 5500 microscope base Figure 2 15 Wiring diagram for breakout box ...

Page 54: ...d damping materials The vibration isolation system damps incoming vibrations through the use of bungees and suspended mass The system is designed to be accessed from either the left or right side as both the door and cable ports are reversible The enclosure is considered a mandatory option as the improvements it provides for imaging are essential for all but the most stringently controlled environ...

Page 55: ... To accomplish the steps in the following chapters some familiarity with PicoView is required The software steps will be documented briefly in this manual For more information on the software please review the online PicoView User Guide The online User Guide is intended to explain the use of the PicoView screens and controls Click the keyboard F1 button from most PicoView windows to access this He...

Page 56: ...ludes the hardware required for MAC mode which greatly improves imaging in fluid The options include the MAC controller Figure 2 17 the Top MAC nose assembly AAC nose assembly and or MAC sample plate Figure 2 17 Mac Mode Module MAC III Mode MAC III Mode provides the benefits of regular MAC mode provides three lock in amplifiers for flexibility enables EFM and KFM imaging and provides Q control for...

Page 57: ...e during imaging Additional information is provided in Chapter 13 Thermal K Thermal K provides a method for accurately determining the force constant of the cantilever for highly accurate force measurements By measuring the thermal oscillation of the cantilever with no drive signal applied the cantilever force constant can be determined The option includes a separate acquisition card that is insta...

Page 58: ...00 SPM body can be place directly on top of this small glove box shown in Figure 2 20 offering greater environmental control Since the piezo and electronic parts are totally isolated from the imaging environment it is possible to perform experiments under very reactive conditions without damaging the system or the sample Additional information is provided in Chapter 15 Figure 2 20 Glove box ...

Page 59: ...n either aqueous or non aqueous solutions Additional information is available in Chapter 16 PicoTREC The PicoTREC molecular recognition tool kit Figure 2 21 provides a faster method than force volume spectroscopy for distinguishing molecular binding events You can also use PicoTREC to explore dynamic properties of biological systems by imaging patterns of molecular binding and adhesion on surfaces...

Page 60: ... The Keysight 5500 SPM is typically installed by trained Keysight technical staff This chapter includes information on the facilities requirements and preparation needed prior to installation It also offers suggestions on how to handle and re connect the components should you ever need to relocate the system after installation Component and Facility Dimensions The Keysight 5500 SPM system includes...

Page 61: ...III Controller 254 mm W x 127 mm H x 254 mm D 10 in W x 5 in H x 10 in D Vibration Isolation Chamber 521 mm W 915 mm H 603 mm D 20 5 in W x 36 in H x 23 75 in D The most common system configuration includes the 5500 SPM within a vibration isolation chamber with the controls on a separate table from the rest of the components as shown in Figure 3 1 on page 3 top and front views Keeping the chamber ...

Page 62: ...5500 SPM User s Guide 5 3 pounds therefore a solid table that can easily accommodate 300 pounds is required Figure 3 1 Top and front views of Keysight 5500 SPM suspended inside the isolation chamber on the left The control station is on the right ...

Page 63: ...uipment as far away as possible from facility equipment such as air handlers and pumps Keep far away from any source of strong electromagnetic fields Reduce the exposure of the SPM to air flow or dramatic temperature changes Minimal temperature variation is desirable to minimize thermal drift during measurements and to minimize settling time Use dedicated power outlets with surge protection strong...

Page 64: ...tave band velocity spectra called vibration criterion curves Figure 3 2 to define acceptable environmental noise For operation of the Keysight 5500 SPM facility acoustic noise should be less than 75 dBc In order to achieve the Table 2 Keysight 5500 SPM utility requirements Configuration Keysight 5500 SPM Electrical 1600 W single phase 100 120 V or 220 240 VAC 5 A 50 60 Hz Surge protection Strongly...

Page 65: ...gure 3 2 Vibration criterion curves and ISO guidelines Temperature and Humidity Variation Changes in temperature and humidity will affect both resolution and repeatability of imaging Temperature variation should be limited to 2 degrees Fahrenheit Humidity variation should not exceed 20 RH Locating the instrument away from vents and air handlers will help meet this goal ...

Page 66: ...the box and remove the packing bag Save the packing materials for subsequent use Figure 3 3 Vibration isolation chamber with labeled components CAUTION The chamber is very heavy Using the lifting handles see Figure 3 3 on the sides of the chamber two people should move the enclosure to a rigid desk or table Do not use the chamber door to support any weight ...

Page 67: ...g the mounts pin to the right 2 Attach bungee cords to eyebolts on adjustable bungee mount using bungee cord hook 3 Lift back side of instrument platform and tilt up towards bungee hooks Attach the back two bungee cord hooks one at a time to recessed attachment points as shown in Figure 3 4 on page 8 a Insert hook into recess hole parallel to the attachment bar b Turn hook ninety degrees Figure 3 ...

Page 68: ...gee mount Figure 3 5 Adjusting bungee mounts to level the instrument platform Switching Door Orientation The door may be hinged on either the left or right side as needed 1 Using the 2 5 mm hex wrench from the accessory bag detach the 12 fill screws 4 of 12 shown in Figure 3 6 from the door and chamber body Keep the screws for reattachment Figure 3 6 Fill screws on door and chamber body ...

Page 69: ...e door back into place and support weight from below Use wrench to attach hinge to door 6 Use wrench to reattach door latch and to reattach fill screws Managing Cables There are cable ports on both sides of the enclosure Before installing instrument select which side of the enclosure the instrument cables should be ported through If necessary remove port cover and place in port which will not be u...

Page 70: ...Setting Up the Keysight 5500 SPM 5 Keysight 5500 SPM User s Guide 5 11 Figure 3 8 Cables installed with good seal ...

Page 71: ...ing for the standard 5500 SPM is shown in Figure 3 9 Other cabling configurations are included in Appendix A Figure 3 9 Cabling for basic 5500 SPM configuration CAUTION Always make sure that all cables are connected before turning on any of the components Failure to do so can result in damage to equipment ...

Page 72: ...t meet all of the facility specifications described above Turn off all components before disconnecting cables Disconnect all cables before moving any components Remove the scanner detector and sample from the 5500 SPM before moving the microscope base Remove the microscope base from the vibration isolation chamber and transport both separately Follow the cabling diagrams exactly being sure to conn...

Page 73: ...e assembly can interfere with the optical path of the laser Regularly clean the window with cotton or a soft tissue dry wetted with water or with ethanol The glass is glued to the nose cone with chemically resistive epoxy so if the window breaks there is no easy way to replace it and the entire nose assembly will likely need to be replaced Only remove the nose assembly from the scanner using the N...

Page 74: ...ric ceramics Applying excessive lateral force while exchanging nose assemblies or dropping the scanner even a short distance onto a hard surface will damage the scanner If the nose assembly housing becomes loose or can be wiggled when in place contact Keysight support for assistance Cracked or broken piezoelectrodes will result in abnormal imaging Damage to the scanner such as those described abov...

Page 75: ...tector 4 22 Mounting the Sample 4 26 Using the Video System 4 29 The Keysight 5500 SPM is capable of imaging in many different modes Several steps of the imaging process are similar or identical however for all modes This chapter will cover the steps that are common to most imaging procedures Setting Up the Scanner Assembly As mentioned earlier the Keysight 5500 SPM is a tip scanning system in whi...

Page 76: ...One Piece Nose Assembly Inserting the One Piece Nose Assembly The nose assembly is held in the scanner by an O ring around its circumference To insert a nose assembly first place the scanner in the scanner mounting fixture Figure 4 1 Place the nose assembly in the socket on top of the scanner aligning its contact pins if applicable CAUTION The thickness of the piezo elements determines how much th...

Page 77: ...pressure at the edges to insert the nose assembly as shown on left O ring should be fully inside socket as shown on right CAUTION Push evenly and straight down when inserting the nose assembly Small off axis forces will create LARGE torques about the anchor point for the piezoes where most breakage occurs Do NOT push down on the top of the nose assembly as this will damage the spring clip and or g...

Page 78: ...ceptable procedure for removing the nose assembly Figure 4 3 Nose assembly removal tool 1 Place the scanner in the scanner mounting fixture 2 Carefully slide the removal tool onto the nose assembly ensuring that the opening seats on both sides of the nose 3 Position your thumb on the flat surface of the removal tool and your fingers on BOTH sides of the extraction arm 4 Gently pull up with your fi...

Page 79: ...UTION Do not use the nose removal tool to insert a nose assembly It is not designed for this purpose CAUTION DO NOT use tweezers to remove the nose assembly Figure 4 5 Tweezers can create a pivot point to lever the nose out of the scanner placing large lateral forces on the piezo assembly The nose assembly removal tool is the only acceptable method for extracting the nose from the scanner ...

Page 80: ... the scanner Inserting a Probe in the One Piece Nose Assembly Keysight nose assemblies are designed with a spring and guides to retain the probe in the proper position for imaging A spring key Figure 4 6 is included with the system to let you safely hold back the spring while inserting the probe Figure 4 7 shows a properly positioned probe Figure 4 6 Spring key ...

Page 81: ...ner into the scanner mounting fixture 3 Grasp the tweezers in the orientation shown in Figure 4 8 4 Gently grasp the probe from its sides applying just enough pressure to secure it in the tweezers It is often easier to take the probe from the case as demonstrated in Figure 4 8 than to try to grasp the probe with the case sitting on the desk or table This method allows the probe to be held at an an...

Page 82: ...t back until it contacts the scanner body 6 Place the probe between the guides such that a little more than half of the probe extends over the lens placement will vary depending on the type and shape of the probe Figure 4 9 shows this process The final probe position should be as shown in Figure 4 7 on page 7 Figure 4 9 Hold back the retaining spring while placing the probe 7 Gently lower the spri...

Page 83: ...he body The proper attachment of the disk is ensured by aligning the three positioning guides on the body of the nose cone with the tabs on the disk Figure 4 10 Two piece nose assembly removal tool and assembly fixture The nose assembly disk is shown on the fixture the body is shown to its left Inserting the Body of the Two Piece Nose Assembly As with the one piece nose assembly the body of the tw...

Page 84: ...nly acceptable procedure for removing the nose assembly body Figure 4 11 Two piece nose assembly removal tool 1 Place the scanner in the scanner mounting fixture 2 Remove the nose assembly disk from the body by gently pulling it up from its edges 3 Carefully slide the removal tool onto the nose assembly ensuring that the opening seats on both sides 4 Position thumb on the flat surface of the remov...

Page 85: ... assembly 1 Place the nose assembly disk on the assembly fixture as shown in Figure 4 12 Make sure that it aligns with the center disk and two small alignment pins Figure 4 12 Two piece nose assembly disk on fixture 2 Using tweezers gently grasp a probe from its sides applying just enough pressure to secure it in the tweezers 3 Move the assembly fixture lever to the right which will slightly separ...

Page 86: ...close the nose assembly disk 7 Use the tweezers to finely adjust the probe such that the cantilever is aligned over the alignment spot Only grasp the probe from the sides to avoid damaging the cantilever 8 Grasping the nose assembly disk from the edges remove it from the fixture and align it on the nose assembly body already in the scanner Inserting the Scanner and Connecting Cables At this point ...

Page 87: ...4 Attach the high voltage red and low voltage blue cables on either side of the scanner to the sockets on the microscope base The cables are color coded to avoid confusion If you are using a closed loop scanner connect its third cable to the C L socket on the rear of the Head Electronics Box CAUTION Be sure to withdraw tip from sample surface before disconnecting cables and removing scanner from m...

Page 88: ...n the cantilever and align the laser spot Figure 4 15 If the sample is not reflective use a piece of gold film on mica or other reflective sample The laser spot will be visible in the video image until it crosses the cantilever so you can use a similar procedure to the paper method below See Using the Video System later in this chapter Figure 4 15 Using video system to align laser Figure 4 16 show...

Page 89: ... Imaging 5 Keysight 5500 SPM User s Guide 5 15 detector Due to the variation of cantilever types and vendors the position of the laser on the cantilever needs to be optimized for each tip Figure 4 16 Laser alignment ...

Page 90: ...from microscope base for clarity Another method is to place a white card or piece of paper under the scanner as it sits in the base to make the laser spot visible By moving the laser you can then align it on the probe when this happens the probe will block the laser spot and the spot will no longer be visible on the paper 1 Place a white piece of paper or business card on the table below the micro...

Page 91: ...ard is 700 nm to 1400 nm 2 Turn on the Head Electronics Box which will activate the laser You should be able to see the red laser spot on the paper Figure 4 18 Figure 4 18 Aligning laser spot over white paper The laser alignment knobs are located on the top of the scanner Figure 4 19 The front to back knob moves the laser spot toward the ...

Page 92: ...e lateral position Figure 4 19 Use the scanner knobs to position the laser spot 3 Rotate the front to back knob clockwise to move the laser spot onto the cantilever chip Diagram B in Figure 4 20 When the laser reaches the chip it will be blocked and will no longer be visible on the paper You should only need to turn the knob a few rotations ...

Page 93: ... 20 As the laser passes over the cantilever it will disappear and reappear from the paper in rapid succession When the laser is on the cantilever the reflection will be visible on the frosted screen 6 Turn the front to back knob counterclockwise to move the spot down the cantilever toward the tip until the spot on the frosted glass disappears and the spot reappears on the paper Diagram E in Figure...

Page 94: ...r cantilevers A potential error during the alignment process is to turn either of the positioning controls too far in the wrong direction and to thereby lose the laser spot altogether Figure 4 22 shows the positioning controls when they are well out of alignment The left to right knob will be visibly tilted when the lateral alignment is far out and the laser housing will be moved to one side when ...

Page 95: ... Imaging 5 Keysight 5500 SPM User s Guide 5 21 the laser back to the center of its travel in both directions Doing so should make the laser spot reappear Figure 4 22 Laser alignment control when far out of alignment ...

Page 96: ...es over the sample surface As shown in Figure 4 23 the detector senses the movement of the laser spot between the four quadrants reporting the AFM vertical deflection LFM lateral or friction and SUM signals Figure 4 23 Photodiode detector operation To install the photodiode detector insert it into the scanner until it stops Figure 4 24 Plug the detector cable into the Detector socket on the ...

Page 97: ... going to the rest of the electronics Gain is disabled when all four switches are pushed up away from the adjustment knob Each switch represents one of the four quadrants in the photodetector therefore all switches should be either up for normal operation or down to increase the signal when using less reflective cantilevers Detector alignment is completed through the PicoView software 1 Launch Pic...

Page 98: ... switch on the Head Electronics Box HEB so if the check box is cleared the laser will not turn on regardless of the position of the HEB switch and vice versa 2 Use the knobs on the detector to move the laser spot to the center of the four quadrants The front deflection knob moves the spot up clockwise or down counterclockwise The left friction knob moves the spot to the left clockwise or to the ri...

Page 99: ...tion of the detector using the laser spot on the frosted screen on the scanner 4 For Contact Mode the dotted yellow line Figure 4 26 shows the recommended vertical alignment of the laser prior to approaching the sample Figure 4 26 Align spot to yellow dotted line for Contact Mode ...

Page 100: ...gnet on the standard sample plate Large flat samples can be held down using the clips from the liquid cell plate Double back tape can also be used though the tape tends to deform easily and can lead to creep during imaging 2 Place the front alignment tab of the sample plate over the front alignment pin as in image A of Figure 4 27 CAUTION Verify that there is enough space between the scanner and s...

Page 101: ... User s Guide 5 27 Figure 4 27 Mounting a sample plate 3 Place the second alignment tab over the alignment pin as in image B of Figure 4 27 Keep the sample plate at an angle so as not to bring the tip into contact with the plate inadvertently ...

Page 102: ...connect the sample plate to the socket on the underside of the microscope stand The 3 pin EC cable provides bias to the sample The 3 pin MAC connector provides signal to the magnetic coil for MAC Mode Figure 4 28 EC MAC cable CAUTION The sample plate magnets are quite strong and if allowed to will snap the sample plate into position which may perturb the sample Holding the plate at the edges while...

Page 103: ...tor and or optics by loosening the knobs at either end Turn on the illuminator with the switch on the front of the box Increase intensity by turning the Illumination Level knob clockwise or decrease it by turning it counterclockwise Figure 4 29 Turn on the illuminator and adjust intensity NOTE The video system camera automatically adjusts to the brightness level Above a certain level turning up th...

Page 104: ...onmental Chamber or other optional hardware by loosening the clamp bolt on the stop Be sure to support the camera to prevent it from sliding down when the clamp is loosened Figure 4 30 Adjusting the video camera focus To adjust the lateral position of the video system relative to the scanner turn the knobs on the front and right side of the optics assembly Figure 4 31 Turn the front knob clockwise...

Page 105: ...kwise to move the field of view to the right and counterclockwise to move left Figure 4 31 Adjusting lateral position of the video system Twist the Zoom control Figure 4 32 to the left to increase the zoom or to the right to decrease zoom Figure 4 32 Adjusting zoom ...

Page 106: ...Preparing for Imaging 5 Keysight 5500 SPM User s Guide 5 32 Choose Controls CameraView to view the video output from the camera Figure 4 33 Figure 4 33 Camera View window showing tip and sample ...

Page 107: ... a constant height for high resolution imaging of very flat surfaces It is typical in Contact Mode to image deflection error signal friction and or topography though other signals may be imaged as well This chapter will outline the steps in making Contact Mode images with a system that is calibrated and properly set up Additional factors may affect the quality of images produced in Contact Mode To...

Page 108: ...tor between the Setpoint and actual cantilever deflection is read as the Deflection To begin imaging follow the steps detailed in Chapter 4 1 Insert the nose assembly into the scanner 2 Insert a probe into the nose assembly 3 Place the scanner in the microscope and connect the cables 4 Align the laser on the cantilever 5 Insert and align the detector 6 Prepare the sample and place it on the sample...

Page 109: ...ou until the tip is slightly out of focus Figure 5 2 Figure 5 2 Lower focal plane just below tip e Using the Close switch on the HEB raise the sample until the sample comes nearly into focus The tip should now be just above the sample surface CAUTION Raise the sample slowly and carefully to avoid collision with the sample Hard contact between the tip and the sample can damage either or both ...

Page 110: ...is set appropriately a Note the Deflection reading on the HEB front panel or in the PicoView Laser Alignment window both will display the same value This is the current cantilever deflection stated in volts b Open the Scan and Z controls window c In the Scan and Z Controls Servo tab Figure 5 4 enter a Setpoint value slightly more positive than the current Deflection reading This sets the deflectio...

Page 111: ...too far from the surface for the system to maintain the Setpoint The indicator will turn green when contact is made and the Setpoint is maintained A yellow bar will show the position of the piezo within its available range of motion The center of the range is defined as zero with positive values indicating piezo displacement away from the sample and negative NOTE If the Servo window is not already...

Page 112: ...d P Gain are set to 10 These gains dictate how quickly the system will react to changes in tip deflection in order to maintain constant force 10 is a good starting value more information on optimizing the gains is in Gains on page 10 15 In the Scan Controls section of the Scan and Z Controls window select the Scan tab Figure 5 5 Figure 5 5 Scan and Z Controls window Scan tab Figure 5 6 Scan Contro...

Page 113: ... and Y Enter X Offset and or Y Offset values to move the scan region You can also click and drag the yellow box to move the region Click the button to return the offsets to zero 19 In the Realtime Images window choose to display Topography Deflection and Friction Click the button of the window to add a buffer To set what each buffer will display click the buffer title then select the Input Signal ...

Page 114: ...gnal which is plotted as the Friction image in volts Changes in lateral force on the tip can be caused either by changes in frictional properties across the sample or by variations in topography The Friction signal will therefore be a convolution of these two components Comparing the friction and topography images helps to differentiate the impact of topography versus friction At the end of each s...

Page 115: ...es The scan speed can also be faster since the system will no longer attempt to react to changes in deflection The error signal in volts is used to generate an image that is sensitive to small changes in topography Fine Tuning the Image Besides the sharpness of the scanning tip the quality of imaging in Contact Mode is largely dependent on three factors the Setpoint voltage feedback gains and scan...

Page 116: ...me iteration may be required to reach the optimal value Gains The I and P gains in the Servo window dictate how quickly the feedback system reacts to changes in deflection Typically the I Integral and P Proportional gains are set to the same value the I gain setting has a much greater effect on imaging than the P gain When the gains are set too high the system will overcompensate to correct change...

Page 117: ...peed will be 2 5 lines second for smooth surfaces For rougher surfaces a lower scan speed may be needed A typical resolution of 256 pixels line provides good resolution and speed Increasing the resolution will improve image quality but will require longer imaging times One good option is to scan a large region at low resolution and high speed and then to zoom in on a region of interest for a high ...

Page 118: ...red to control the height of the tip above the sample Through this method lateral forces on the tip are virtually eliminated enabling higher resolution imaging than is possible with Contact Mode The process for imaging in AC Mode is similar to that of Contact Mode with one additional step the cantilever must be tuned to determine the resonant frequency There are two methods for providing the oscil...

Page 119: ...s 18 per volt for the MAC Mode and MAC III controllers To use a MAC Mode Module open the Setup window by selecting Controls Setup from the main PicoView menu or click the Setup button in the main toolbar Open the System Components tab and verify that the Serial Port AC Mode Controller check box is selected ...

Page 120: ...nN nm Any sample plate can be used Figure 6 1 AAC Mode nose assembly AAC Mode 1 To image in AAC Mode first follow the steps from Chapter 4 a Insert the nose assembly into the scanner b Insert a probe into the nose assembly c Place the scanner in the microscope base d Align the laser on the cantilever e Insert and align the detector f Prepare the sample and place it on the sample plate 2 Choose Con...

Page 121: ...ll be used to configure the sweep through a range of frequencies The resultant plot should show one strong sharp resonance peak The cantilever storage box or data sheet will indicate the range in which the primary resonance frequency of the cantilever will be found There are two options for finding the resonant frequency of the cantilever Auto or Manual Tune In most cases the Auto Tune procedure w...

Page 122: ...r the Start and End frequencies in kHz for the tuning sweep For a new or unknown cantilever use the stated minimum and maximum frequencies given on the storage box If the resonance frequency range is known more exactly a smaller range can be used to speed the tuning process NOTE If the system is using the AC source in the HEB the Setpoint needs to be set to zero to perform Auto Tune If the system ...

Page 123: ...approaches the sample 11 Click the Auto Tune button The system will sweep several times through the range of frequencies specified in the Auto Tune tab and will locate the resonant frequency of the cantilever The Drive will be adjusted automatically to set the amplitude at the resonant frequency to the value set in the Peak Amplitude box Finally the AC drive frequency will be set to the resonant f...

Page 124: ...k the Approach button in the PicoView toolbar The system will raise the sample until the amplitude is damped to the Stop At percentage Because of air damping oscillation typically decreases as the tip nears the sample The software monitors the rate of change of amplitude as well as the absolute value so the final amplitude will not be exactly the Stop At percentage 18 In the Servo tab set the I Ga...

Page 125: ...e is scaled by the Z piezo sensitivity and plotted as topography in nanometers At the end of each scan line the system will retrace the line to the beginning of the scan Depending on the Frames setting in the Scan Controls section the system will either scan once and stop or it will scan infinitely overwriting the last scan each time You can also specify a specific number of scans to complete To s...

Page 126: ...ler precisely determines and maintains oscillation amplitude and phase relation changes In AAC Mode the oscillator in the nose assembly oscillates the entire system including liquid if imaging in liquid In MAC mode because the oscillation is driven by a magnetic field only the magnetically coated tip oscillates providing a sharper resonance peak and therefore higher resolution imaging MAC Mode is ...

Page 127: ... more complex modes as well Specially coated MAC cantilevers are also required Standard MAC Mode In standard MAC Mode the coil is located in the sample plate Figure 6 6 A Contact Mode or AC Mode nose assembly can be used Figure 6 6 MAC Mode sample plate ...

Page 128: ...lug the EC MAC cable socket to the bottom of the microscope stand Figure 6 7 EC MAC cable left and MAC cable right 2 Connect the MAC cable connector blue and green wires of the EC MAC cable to the 3 pin connector on the MAC cable Figure 6 7 Connect the MAC cable to the 6 pin connector on the sample plate as shown in Figure 6 8 on page 12 ...

Page 129: ...plate as shown in Figure 6 8 Figure 6 8 Cable connections for MAC mode 4 In the ACAFM Controls dialog box Figure 6 3 on page 5 choose MAC as the Drive Mechanism Top MAC Mode In Top MAC Mode AFM the driver coil is located in the nose assembly Figure 6 9 This configuration provides better tip response when imaging thick samples which can lessen the magnetic field oscillating ...

Page 130: ...ion forces between it and the surface By carefully setting system parameters the system can be made to operate entirely in the regime of net attractive forces thereby reducing the effect of the probe tip on the sample The range in which the parameters have to be adjusted can be narrow however making it difficult to maintain in real operation Q Control is a method that reduces damping of the system...

Page 131: ... of the Main tab the ACAFM Controls window Figure 6 10 on left 2 Run a standard AAC Mode Auto Tune This will update the Amplitude Drive and Frequency as shown in the ACAFM Controls window on the right in Figure 6 10 Figure 6 10 Q Control settings in the ACAFM Controls window before left and after right Auto Tune 3 Select the Q Control On check box 4 Click the Optimize button This will set the opti...

Page 132: ...wn below in Figure 6 11 with the Q Control parameters circled in red Figure 6 11 ACAFM Controls and Other tab after Q control optimization Note that negative numbers can be used for the Q Control Drive to lower the Q Control drive amplitude However the standard AC Mode Drive must be a positive number ...

Page 133: ...range as in step 2 to generate a new plot using the values from the Q Control optimization Figure 6 12 below shows the change in the amplitude resonance peak before top and after bottom applying Q Control Figure 6 12 Amplitude resonance peak before top and after bottom optimizing Q Control ...

Page 134: ...AC Modes 5 Keysight 5500 SPM User s Guide 5 17 Note the phase curve will also show a steeper slope as shown below in Figure 6 13 Figure 6 13 Phase before top and after bottom optimizing Q Control ...

Page 135: ...Contact Mode or AC Mode imaging so be sure that you have read the information in Chapter 4 Chapter 5 and Chapter 6 before proceeding with this chapter Scanning Tunneling Microscopy STM In STM a bias voltage is applied between a sharp conducting tip and the sample When the tip approaches the sample electrons tunnel through the narrow gap either from the sample to the tip or vice versa depending on ...

Page 136: ...Keysight multi purpose scanner when equipped with an STM nose assembly Figure 7 1 can be used for STM The nose assembly is available with three different preamplifiers for varying sensitivity Table 3 Figure 7 1 STM nose assembly A dedicated STM scanner Figure 7 2 provides lower current operation and higher resolution The scanner is available with three preamplifier options for varying sensitivity ...

Page 137: ...set to different values as described below Gain Stage Settings As shown in Figure 7 3 the Gain switch set to the right side position gives a gain of 1 When the switch is set to the left side position it gives a gain of 10 Figure 7 3 Gain switch settings for STM scanner Preamp Stage Settings The preamp stage uses a fixed preamp board module as shown in Figure 7 4 It can be replaced with different s...

Page 138: ... procedure described below CAUTION Do not pull the cable while unplugging the module Hold the 4 pin con nector at the end of the cable firmly then unplug the module as shown in Figure 7 5 1 Remove the four screws on the tip holder piece 2 Pull out the preamp module carefully 3 Hold on to the 4 pin connector and unplug the module from the cable 4 Replace the module and plug it back onto the 4 pin c...

Page 139: ...Additional Imaging Modes 5 Keysight 5500 SPM User s Guide 5 5 Figure 7 5 Hold the connector while unplugging the preamp module ...

Page 140: ...ails 2 Insert a tip into the nose assembly or scanner Grasp the tip with a tweezers then insert it into the hollow tube until it protrudes approximately 2 mm Figure 7 6 Figure 7 6 Inserting STM tip wire in scanner 3 Place the scanner in the scanner bracket on the microscope 4 Prepare the sample and place it on a sample plate The sample must be electrically isolated from the sample plate The partic...

Page 141: ...ew choose Mode STM 9 In the Servo window enter the Bias Voltage Figure 7 8 Typical values are 50 200 millivolts 0 05 0 200 V A positive bias indicates current flow from the tip to the sample and vice versa for negative bias NOTE The sample plate cable can transfer low levels of vibration to the sample During very high resolution imaging this can affect images quality We recommend first plugging th...

Page 142: ...until the tip is close to but not touching the scanner The video system is not useful in STM as the tip is essentially vertical so view the tip from the side of the microscope and bring it as close to the sample as you can Be certain to not drive the tip into the sample To be safe you can make the approach length longer which will just add a little time to the approach 15 Click the Approach button...

Page 143: ...useful for locating defects in thin films for molecular recognition studies and for resolving electronic and ionic processes across cell membranes It has proven useful in joint I V spectroscopy and contact force experiments as well as contact potential studies CSAFM imaging can be used in an ambient environment or under temperature or environmental control However as surface contamination especial...

Page 144: ... assembly c Place the scanner in the microscope base and connect its cables d Align the laser on the cantilever e Insert and align the detector 2 Prepare the sample and place it on a sample plate The sample must be electrically isolated from the sample plate The particular mounting arrangement will depend on the sample type and size 3 Attach an electrode from the sample plate to the sample A lengt...

Page 145: ...alue that is slightly more positive than the current Deflection reading on the HEB front panel or PicoView s Laser Alignment window 10 Enter the I and P gains for the z servo which will dictate how quickly the system will adjust to changes in tip deflection A typical starting value is 10 for both gains 11 In the Realtime Images window choose to display images for CSAFM Aux BNC Deflection and Topog...

Page 146: ...o window will change from green to red Raise the Setpoint again until the Servo window indicator just turns green 17 In the Scan and Motor window click the Up or Down arrows to begin the scan During the scan the system will maintain a constant force on the tip and Deflection and Topography will be imaged as in Contact Mode The tip itself will remain at virtual ground as the bias is applied to the ...

Page 147: ...these two components To differentiate friction from topography two LFM images are typically captured side by side One image is constructed from the Friction signal during each trace of the raster scan and the other from the Friction signal during retrace One image can then be inverted and subtracted from the other to reduce the topographic artifacts leaving primarily the effects of friction To ima...

Page 148: ... may be required to achieve satisfactory imaging A MAC Mode or MAC III controller is also required to drive the lateral oscillation With the MAC Mode controller the following cables must be added Connect a BNC cable from the Phase output of the MAC Mode controller to the Aux In of AFM Controller Connect a BNC cable from the Amplitude output of the MAC Mode controller to the Aux BNC on the Head Ele...

Page 149: ...anning parameters When the area of interest has been located stop the scan 10 Set the oscillation frequency for the cantilever a Choose Controls Advanced AC Mode Select Friction as the Input This will cause the lateral signal from the detector to be used for tuning the resonance of the cantilever rather than the deflection signal b Choose Controls AC Mode Tune to open the AC Tune window c In the M...

Page 150: ...rce Modulation Microscopy FMM Force Modulation is another derivative of Contact Mode with similarities to AC Mode as well In FM Mode an additional 20 50 kHz oscillation is applied to the cantilever The amplitude and phase of oscillation will change depending upon the modulus of the surface at any given point The multi purpose scanner and AAC nose assembly are used for FM Mode A specific Force Modu...

Page 151: ...lation 4 Press the Close switch on the HEB to raise the sample until the tip is close to but not touching the sample 5 Use the video system to bring the tip and sample close to contact a Bring the cantilever into sharp focus b Lower the focal plane just slightly below the tip by turning the Focus control toward you until the tip is slightly out of focus c Using the Close switch on the HEB raise th...

Page 152: ...ion of 256 c Scan Size in microns d X Offset and or Y Offset values to set the center of the scan 12 In the Realtime Images window display three images for Topography CSAFM Aux BNC the Phase signal via the MAC controller and HEB Aux the Amplitude signal via the HEB If using a MAC III controller select Aux 1 and Aux 2 13 In the Scan and Motor window click the Up or Down blue arrows to initiate a sc...

Page 153: ...t possible to use much stiffer cantilevers with a spring constant typically in the 10 s of nN nm The interaction between the tip and the sample s stray magnetic field leads to changes in the amplitude and phase of the cantilever oscillations and also to a change of the resonance frequency of the cantilever Since the tip oscillates with a non zero amplitude the distance between the tip and the samp...

Page 154: ...antilever a In the AC Tune window enter the Start and End frequencies in kHz for the tuning sweep typically 20 120 kHz b Set the Peak Amplitude to 3 5 to 5 0 volts c Enter an Off Peak value to offset the oscillation frequency from the cantilever s resonance frequency A typical value is 0 300 kHz Using that setting if the resonance frequency is 72 539 kHz the drive frequency in the AC Tune window s...

Page 155: ...h images to Retrace Figure 7 12 Realtime images settings for MFM with input channels set to Topography and Phase scan modes set for Main and Interleave respectively NOTE It is sometimes useful to open the Trace Retrace window while optimizing imaging parameters The Trace Retrace window inputs are NOT dependent on the settings in the Realtime Imaging window The scan modes should be set to Main in t...

Page 156: ...tilever resonance frequency was 72 539 kHz the Interleave Frequency would be set to 72 639 kHz 3 Set the Interleave Drive so the amplitude is about 1 5 the free amplitude used for the topography scan a Choose Controls AC Mode to open the ACAFM Controls dialog box b Adjust the Drive to determine the value needed to reduce the amplitude for the Interleave setting of 1 5 free amplitude c Enter the Dr...

Page 157: ...tem to stabilize The Pull Away parameter sets the distance the tip is pulled away from the surface to initiate the changes in the drive frequency and the drive amplitude Adjust Pull Away from between 100 and 200 nm to optimize the image Begin imaging 1 Initiate an approach a In the Scan and Motor window click the Motor tab b Set the Stop At to specify the percentage of total oscillation that repre...

Page 158: ...ow to initiate a scan The phase map will show changes in the magnetic force during interleave scanning 5 In the Servo window Main tab and the Scan and Motor window Scan tab adjust the Gain Scan Speed Resolution etc to optimize the topography image 6 In the Interleave tab adjust the Gain Stop At and Pull Away parameters to optimize the MFM phase image ...

Page 159: ...e Lock in 2 signal changes in response to changes in the electric field as the tip passes over the surface The real component of the phase X Component 2 and the total phase can both be mapped A standard topography image can be collected at the same time The two images can then be displayed side by side to highlight correlation between the electrostatic response and topography 1 To image in EFM Mod...

Page 160: ...of the cantilever a In the AC Tune window enter the Start and End frequencies in kHz for the tuning sweep typically 20 120 kHz b Set the Peak Amplitude to 2 5 volts c Enter an Off Peak value to offset the oscillation frequency from the cantilever s resonance frequency A typical value is 0 100 kHz d Click the Auto Tune button The system will sweep through the range of frequencies locating the peak ...

Page 161: ...aise the sample until the amplitude is damped to the Stop At percentage 12 On the EFM tab you will now set up the MAC III controller s second lock in to provide the AC bias Use the AC Tune window to verify that this signal is at a frequency that does not add unwanted tip responses a In the Servo window note the Setpoint value Change the Setpoint to 10 V to move the tip several microns above the sa...

Page 162: ...to zero making it easier to interpret phase changes from the current value 15 On the EFM tab click Optimize Phase This will shift the phase of the Lock in 2 signal to maximize the X component of phase 16 In the Servo window set the I Gain and P Gain to 5 These gains dictate how quickly the system will react to changes in amplitude 17 In the Scan and Motor window s Scan tab enter a Scan Speed of 1 ...

Page 163: ...nection an AC nose assembly and a MAC III controller to provide the drive signals Lock in 1 is used to drive the cantilever Lock in 2 provides an AC bias The MAC III internal servo drive provides the DC bias to counteract tip deflection The procedure for imaging in KFM Mode is the same as that for EFM Mode with the additional step of setting up the DC bias servo This should be completed after appr...

Page 164: ...e value for the End parameter in the Spectroscopy window 9 Click on the blue triangle to begin the piezo movement and observe the SP response in the Spectroscopy window 10 In the Advanced AC Mode Controls window Other tab increase the Setpoint value in small increments until the SP vs Distance plot is as horizontal as possible Hold down the Shift and Ctrl keys while pressing the Up arrow on the ke...

Page 165: ...copy Force spectroscopy is widely used in air liquids and different controlled environments It may involve functionalized tips to study specific interactions of conjugated molecules or chemically modified surfaces In order to quantitatively measure interaction forces it is necessary to know the bending stiffness also referred to as the spring or force constant of the cantilever as accurately as po...

Page 166: ... Mode imaging as described in Chapter 4 Preparing for Imaging and Chapter 5 Contact Mode Imaging For more accurate measurements use a Closed Loop scanner and follow the CL scanner calibration prior to acquiring Force vs Distance data Select the CL Sweep check box in the Setup tab of the Spectroscopy window 1 Choose Mode Contact 2 In the Servo dialog box Figure 7 17 set the following parameters as ...

Page 167: ...imize the End values a Enter a large number for the Start value ie 999 and PicoView will adjust to the maximum value for the scanner b Enter a large negative number for the End value ie 999 and PicoView will adjust to the minimum value for the scanner 10 If using a calibrated CL scanner select the CL Sweep check box as shown in Figure 7 18 in the Z Closed Loop section of the Setup tab Figure 7 18 ...

Page 168: ...d by a check mark next to Auto Save in the Spectroscopy File menu Begin to take force measurements For the initial acquisition it is recommended that Toggle Auto Full Scale be turned On 1 Start the sweep by clicking the Start button 2 Stop measurements at any time by clicking the Stop button 3 After the initial sweep has completed adjust the sweep range as needed using the Start End parameters in ...

Page 169: ...Additional Imaging Modes 5 Keysight 5500 SPM User s Guide 5 35 An example of a closed loop Force vs Distance sweep is shown in Figure 7 19 Figure 7 19 Closed loop force spectroscopy example ...

Page 170: ...ecting spectroscopic data The procedure described below covers general guidelines for FlexGrid Spectroscopy in Contact Mode It is a user dependent choice to select Contact vs AC Mode FlexGrid Spectroscopy Procedure for Contact Mode This procedure is done after the system has been prepared for Contact Mode imaging as described in Chapter 4 Preparing for Imaging For more accurate measurements use a ...

Page 171: ...nu or in the status bar at the bottom of the Spectroscopy window 6 Approach the tip 7 In the Spectroscopy Basic tab set the Sweeps as needed to either 1 or 8 In the Spectroscopy Setup tab set the Duration to 1 9 Set the Data Points to 200 10 Maximize the Start and minimize the End values a Enter a large number for the Start value ie 999 and PicoView will adjust to the maximum value for the scanner...

Page 172: ...L Sweep check box selected 12 Click the FlexGrid tab in the Spectroscopy window to display the topographic image The transparency of the image can be adjusted by clicking on it and rolling the mouse wheel 13 Using the Add Point tool in the Spectroscopy window click on one or more areas of interest in the image as shown in Figure 7 22 Figure 7 22 FlexGrid tab of the Spectroscopy window with specifi...

Page 173: ...o Full Scale be turned On 1 Start the sweep of selected points by clicking the Start button 2 Stop measurements at any time by clicking the Stop button 3 After the initial sweep has completed adjust the sweep range as needed using the Start End parameters in the Spectroscopy Setup tab After force measurements have been collected extract the material properties and generate plug in maps 1 In the Sp...

Page 174: ...Additional Imaging Modes 5 Keysight 5500 SPM User s Guide 5 40 Figure 7 23 Plug in Images window ...

Page 175: ...with up to image pixel resolution points The procedure described below covers general guidelines for Volume Spectroscopy in Contact Mode It is a user dependent choice to select Contact vs AC Mode Volume Spectroscopy Procedure for Contact Mode This procedure is done after the system has been prepared for Contact Mode imaging as described in Chapter 4 Preparing for Imaging For more accurate measurem...

Page 176: ...u or in the status bar at the bottom of the Spectroscopy window 6 Approach the tip 7 In the Spectroscopy Basic tab set the Sweeps as needed to either 1 or 8 In the Spectroscopy Setup tab set the Duration to 1 9 Set the Data Points to 200 10 Maximize the Start and minimize the End values a Enter a large number for the Start value ie 999 and PicoView will adjust to the maximum value for the scanner ...

Page 177: ...y window To save successive force measurements have files saved automatically after each force curve 1 In the Spectroscopy window choose File Set filename 2 In the Save As dialog box enter a filename for the data set Note the file type will default to mi 3 Click the Save button Turn on Auto Save by choosing File Auto Save The title bar at the top of the window will indicate Auto Save is on It will...

Page 178: ...g in maps 1 In the Spectroscopy window click the Show Plug in Images tool 2 In the Plug in Images window click the button to add to add up to eight windows 3 To set what each window will display select the desired spectroscopy and math plug in inputs from the pull down menus The lists will vary depending on the imaging mode NOTE As for FlexGrid Spectroscopy the scan to point section of the Volume ...

Page 179: ...ws with different inputs selected are shown in Figure 7 27 Figure 7 27 Volume spectroscopy plug in windows with inputs selected The results of volume spectroscopy plug in analysis and two dimensional maps of material properties are shown in Figure 7 28 Figure 7 28 Output of volume spectroscopy plug in window analysis ...

Page 180: ...on Linearity 8 5 Sensitivity 8 5 Other Characteristics 8 6 Bow 8 6 Cross Coupling 8 6 Aging 8 6 Creep 8 7 Calibrating the Multi Purpose Scanner 8 8 X Calibration 8 9 X Non Linearity 8 10 X Hysteresis 8 11 X Sensitivity 8 13 Y Calibration 8 14 Y Non Linearity 8 14 Y Hysteresis 8 15 Y Sensitivity 8 16 Non Orthogonality 8 17 Z Calibration 8 18 Sensitivity 8 18 Servo Gain Multiplier 8 19 Archive the C...

Page 181: ...sistent worry free operation However scanners contain extremely delicate components and must be treated with care to maintain their high level of operation This chapter discusses regular maintenance of the scanner nose assemblies and probes as well as regular calibration procedures for the multi purpose open loop scanner ...

Page 182: ...embly Store nose assemblies in a clean dry location where they will not be subject to excessive humidity temperature changes or contact The scanner fixture is designed with a socket to safely hold a nose assembly while you are working with the scanner This is not a permanent storage location but it is a safe way to keep the nose assembly close at hand Dirt grease or spots on the glass window of th...

Page 183: ...emperature changes or contact Keysight recommends that scanners be stored in a desiccator Use care when moving the scanner on its assembly stand as it is not secured to the stand and can be damaged if dropped The scanner contains very brittle and fragile piezoelectric ceramic components Applying excessive lateral force while exchanging nose assemblies or dropping the scanner even a short distance ...

Page 184: ...pacing The image was made with an uncalibrated scanner Features are larger at the start of each scan line and also at the bottom of the image This effect is the result of non linearity of the piezo response across the scan range Figure 8 1 Image from an uncalibrated scanner showing non linearity Sensitivity The features in Figure 8 1 also change size within each scan line Lateral feature sizes may...

Page 185: ...fect in which movement of the scanner along one axis usually X or Y causes unwanted movement along the other axis Z Systems using tube scanners are more susceptible to geometric cross coupling because a single four quadrant tube provides motion in all the three axes The larger Keysight multi purpose scanners with 90 micron X Y scan range use separate piezoelectric elements for X Y movement and for...

Page 186: ...ter this initial burn in the aging rate is very slow however calibration once or twice per year is still recommended Creep At a constant applied voltage the piezo position will change slightly over time most noticeably at the beginning of a scan or after a change on scan location Creep appears as elongation of the feature in the direction of the offset because of this slow movement Figure 8 3 Figu...

Page 187: ... measurements to obtain an image of the calibration target Use the following settings a Deflection 0 8 to 1 0 V b Setpoint voltage 0 V c Scan Size 90 microns d Resolution 256 e Scan Speed to 1 ln s 4 Make sure that the target is positioned such that its features are aligned in both the X and Y directions Use a Cross Section tool Horizontal Vertical or Real Time in the Realtime Images window from e...

Page 188: ...ibration 5 Keysight 5500 SPM User s Guide 5 9 X Calibration In the Realtime Images window set up two Topography images one for Trace and one for Retrace Figure 8 4 Figure 8 4 Images of calibration target during Trace and Retrace ...

Page 189: ...the Open Loop tab Figure 8 5 Scanner Setup dialog box X Non Linearity In the Realtime Images window choose Tools Horizontal Cross Section Use markers to report the dimensions between sets of features at either end of the scan range Figure 8 6 Figure 8 6 Horizontal cross section tool used to check non linearity Two sets of cursors are shown ...

Page 190: ...orrection term Adjust Non linearity 1 for the Trace scan and adjust Non linearity 2 using the Retrace scan You can also use the diagram in Figure 8 7 as a guide Figure 8 7 Correction diagram for X non linearity After adjusting the X Non linearity parameters re scan the calibration target The spacing between features should be approximately the same across the scan range for the Trace and Retrace s...

Page 191: ...Scanner Maintenance and Calibration 5 Keysight 5500 SPM User s Guide 5 12 is not the case as in Figure 8 8 increase the X Hysteresis value and re scan Figure 8 8 Misalignment between trace and retrace ...

Page 192: ...8 9 Several iterations may be necessary to align all edges in the Trace and Retrace images Figure 8 9 Features align properly after X Hysteresis adjustment X Sensitivity Using the Cross Section tool from the Realtime Images window measure the length of a set of features across the scan Figure 8 10 Figure 8 10 Cross section of several features to check X Sensitivity ...

Page 193: ...s that the scan range will be set to of the scanner s full range The Y axis is generally used as the slow scanning axis so the range will be reduced as a time consideration Only one Topography image is required for Y calibration The other image can be assigned to display flattened Topography data Y Non Linearity Obtain an image of the calibration target Using the Cross Section tool set markers at ...

Page 194: ...for the Up scan and adjust Non linearity 2 using the Down scan Use the diagram in Figure 8 12 as a guide for making the correction Figure 8 12 Correction diagram for Y Non linearity After adjusting the Y Non linearity parameters re scan the calibration target The spacing between features should be approximately the same across the scan range for the Trace and Retrace scans Y Hysteresis The next st...

Page 195: ...irection focus on one step of the grating As the scan data is plotted position a marker on this edge Wait for the scan in the opposite direction to occur and position a second marker on the same edge after the plot has been updated In the example below about 2 microns of hysteresis can be measured using this method After increasing or decreasing the Y Hysteresis term alignment of the individual ed...

Page 196: ...g the Angle tool measure the angle between features at all four corners of the image The image below Figure 8 15 shows one of the four corner measurements Figure 8 15 Angle measurement for calibrating Non orthogonality Adjust the Non orthogonality term in the Open Loop tab of the Scanner Setup dialog box until the angle measures as close to 90 as possible for NewSensitivity CurrentSensitivit y Kno...

Page 197: ...d Y dimensions have been calibrated obtain an image of a Z calibration standard and render the data as Tilted Zoom in on a single pit to minimize distortion Position the cross section tool over a Z feature Place markers at the top and bottom of the feature Measure the step size Figure 8 17 Cross section checking feature height for Z sensitivity It is important to correctly position the markers for...

Page 198: ...up to a point the signal would be relatively smooth as the system accurately tracked the sample surface At some gain level however the oscilloscope image will begin to display small high frequency oscillations This is similar to feedback in a microphone with the gains so high that each oscillation is multiplied and fed back into the signal The Servo Gain Multiplier is a factor that sets the point ...

Page 199: ...sition to the expected position Closed loop scanning improves scan linearity provides more accurate probe positioning and overcomes the effects of creep hysteresis etc Scanner Types Two types of closed loop scanners are available for the Keysight 5500 SPM Z axis closed loop and X Y Z closed loop Z Axis Closed Loop Scanner The Z axis closed loop scanner provides exceptional Z axis positioning for v...

Page 200: ...coders on the X and Y axes These sensors allow for very linear scans and also make it easy to move to precise locations on the sample Calibration Keysight recommends calibrating the Gains Offset and Sensitivity settings in the Closed Loop tab of the Scanner Setup dialog box prior to each use of the closed loop scanner Begin by calibrating the scanner following the open loop instructions in the Cha...

Page 201: ...a cantilever and use the laser alignment controls and camera window to align the laser and detector mode to set up the microscope for Contact Mode Imaging as described in Chapter 5 2 Choose Controls Setup Controller to confirm the appropriate controller definition file 3 Choose Controls Setup Microscope to confirm the appropriate microscope definition file 4 Verify that the correct scanner calibra...

Page 202: ...fset and Gain are typical a Ensure that the Reverse check boxes are selected for X and Z Sensors If not contact Keysight support b Note that the scanner values will be different for each scanner 7 Verify that the Default CL Scan check box is cleared as shown above 8 In the Advanced tab of the Scan and Motor window set Overscan to 0 for Fast and Slow axes ...

Page 203: ...the Scan Size It will adjust automatically to the maximum allowed value b Speed of 1 2 lines second c Resolution of 256 11 In the Realtime Images window create two image buffers with the following settings Input set to X Sensor Flattening set to None Display Range set to 10 V to 10 V For one image display Trace and for the other display Retrace Set both buffers to Main scan mode 12 Choose Tools Re...

Page 204: ...n value displayed on the Head Electronics Box b Click the Approach button c Reduce the Z piezo Range to 0 000 d Click the Center button This avoids the possibility that the piezo will become depolarized by being fully retracted which is where it would be after the false engagement for an extended period of time 15 Click the Up or Down blue arrows in the Scan and Motor window to initiate a scan Whe...

Page 205: ...Closed Loop Scanners 5 Keysight 5500 SPM User s Guide 5 7 Figure 9 4 Initial plot before closed loop scanner calibration ...

Page 206: ...e 5 8 16 In the CL tab of the Scanner Setup dialog box adjust the X Sensor values a Adjust the Offset to shift the line up or down until the left end is close to 10 V b Adjust the Gain to adjust the slope until the right end of the line is close to 10 V ...

Page 207: ...tion graph should now appear as in Figure 9 5 Figure 9 5 Cross Section and Trace Retrace windows after Offset and Gain values optimized 17 In the Realtime Images window change two image buffers to Y Sensor 18 Use the Vertical Cross Section tool to display a Y cross section ...

Page 208: ...e grating in both the X and Y axes 25 Perform all the Contact Mode imaging steps described in Chapter 5 to achieve a good image of the grating 26 Adjust the Sensitivity of the X sensor a In the Realtime Images window choose Tools Horizontal Cross Section Place the cross section tool across a set of features b Set markers in the cross section window to measure the dimension across several features ...

Page 209: ...ical cross section through a line of features Allow the scanner to scan continuously which will update the Cross Section plot each pass through the frame b Use the upward trace and downward retrace scan markers to measure the difference in the acquired data at a given point on the Y axis While scanning in one direction focus on one step of the grating As the scan data is plotted position a marker ...

Page 210: ... 3 In the Spectroscopy Basic tab click the infinity button for continuous Sweeps 4 In the Spectroscopy Setup tab set Duration to 1 5 Set Data Points to 200 6 Maximize the Z piezo motion maximize and minimize the Start and End values respectively 7 Click the Show More button to display more parameters 8 Set the Gains to 3 x 9 In the Spectroscopy plot window set the lower buffer to Z Sensor go to th...

Page 211: ... User s Guide 5 13 Figure 9 6 Select Z Sensor and units for Z sensor calibration 11 Click the blue triangle to start a continuous sweep of the Z piezo 12 A warning message will be displayed Click Yes to proceed with the calibration procedure ...

Page 212: ...sensor output ranges from 10 V to 10 V over the entire range of the Z piezo This procedure sets the range just slightly under 10 V 13 In the Spectroscopy plot window turn Toggle Auto Full Scale Off 14 Set Y Min to 9 8 and Y Max to 9 8 15 In the Z Sensor section of the Scanner Setup dialog box adjust the Offset to change the vertical position of the lines until their left edge is as close to 9 8 V ...

Page 213: ...Spectroscopy sweep with closed loop On 18 In the Scanner Setup Closed Loop tab adjust the Z Range setting to maximize the range A typical starting value is 19 V NOTE The Z piezo is highly sensitive to changes in Offset and Gain To change these values in smaller increments click the mouse in the Offset or Gain box Hold down the Ctrl key while pressing the Up or Down arrows to change the parameter i...

Page 214: ...pits Figure 9 9 Flattening should be set to None Figure 9 9 200 nm deep pit on the calibration standard 4 In the Realtime Images window use a Horizontal or Vertical Cross Section tool to gauge a pit of known depth If the depth does not match the actual value calculate a new Sensitivity value using the following equation 5 Enter the new Z Sensitivity value into the Scanner Setup dialog box 6 Image ...

Page 215: ...Closed Loop Scanners 5 Keysight 5500 SPM User s Guide 5 17 Save the calibration file X Y Z calibration is now complete ...

Page 216: ...Box HEB The main controller supplies high voltage to the scanner piezoes The HEB controls the stage motors and receives information from the photodiode detector The MAC controller supplies the drive signal to the nose assembly as well as routing signals from additional inputs for advanced setups List of MAC Mode Components The components you receive with MAC Mode may vary slightly depending on you...

Page 217: ...sing Connections The MAC Mode controller is shown in Figure 10 1 The rear panel is shown in Figure 10 2 Figure 10 2 MAC Mode controller rear panel The connectors are as follows 1 MAC drive output 2 AAC drive output 3 Input summed to AAC drive signal Figure 10 1 Front panel of the MAC Mode controller ...

Page 218: ...ller at this time Computer Connection Connect the RS 232 serial cable from the SERIAL port on the MAC Mode controller to a COM port on your computer The port number will be automatically detected if your computer has more than one COM port Head Electronics Box Connection Connect the short DB44 cable from the MAC Mode Controller to the CONTROLLER connector on the Head Electronics box HEB Use a DB44...

Page 219: ...for imaging Note the phase conversion coefficient is 18 per volt for the MAC Mode controller In AAC Mode the drive signal can be provided by either the Head Electronics Box or the MAC Mode controller To use the MAC Mode controller as the AC source choose Controls Setup Components then select the Serial Port AC Mode Controller check box The system will now use the drive signal from the MAC Mode con...

Page 220: ...uts Tab 11 28 Other Tab 11 31 Amplitude and Frequency Modulation Techniques 11 33 Setting Parameters for AM Mode Operation 11 36 Setting Parameters for FM Mode Operation 11 40 Piezoresponse Force Microscopy 11 43 The MAC III controller adds imaging modes routing capabilities and other experimental controls for applications requiring additional flexibility in experiment design MAC III works with th...

Page 221: ... compare between modes The MAC III controller is used in conjunction with the AFM controller and Head Electronics Box HEB The AFM controller supplies high voltage to the scanner piezo elements The HEB controls the stage motors and receives information from the photo detector The MAC III controller supplies the drive signal to the nose assembly as well as routing signals from additional inputs for ...

Page 222: ...panel of the MAC III Controller In addition to the standard cabling for your microscope the following connections must be made to use the MAC III in your system A complete wiring diagram is available in Appendix A Power Cord Connect the power cord from the back of the MAC III controller to building power Do not power on the controller at this time Computer Connection Connect the RS 232 serial cabl...

Page 223: ...ected if your computer has more than one COM port Head Electronics Box Connection Connect the shorter DB44 cable from the MICROSCOPE connection on the MAC III controller to the CONTROLLER connector on the Head Electronics box HEB The HEB is meant to be placed on top of the MAC III box Use a DB44 ...

Page 224: ... the CONTROLLER connector on the MAC III to the PicoSPM II connector on the AFM Controller BNC 1 and 2 These connectors are user configured outputs for custom applications AUX The AUX connector has the drive output from each lock in a drive in that can be summed into each lock in and an auxiliary input to each lock in The pin out diagram is shown in Figure 11 3 Figure 11 3 AUX Connector pin out di...

Page 225: ...nd SP_TX lines These serial lines are not currently used Once all connections have been made it is safe to turn on power to all components Hardware and Sample Setup Most hardware and sample setup options with MAC III are identical to those for standard AAC and MAC Mode operation as covered in Chapter 6 AC Modes Please refer to Chapter 6 for the steps required to set up the microscope for imaging N...

Page 226: ...ontroller or AAC III Controller through the 25 pin AUX connector Table 4 List of signals and descriptions for MAC III Signal Access Box Signal Description External Drive Input This is an external input signal in the range of 10 V that can be added to any of the drive outputs To enable summing of this external drive input to any of the lock in drive outputs open the Advanced AC Mode Controls window...

Page 227: ...the drive output of Lock in Amplifier 2 and can be used as the AC stimulus of an external experiment The output is nominally in the range of 10 V A DC bias can also be added by entering a voltage for the Drive Offset in the Lock in 2 tab in the Advanced AC Mode Controls window Lock in 2 Input This is the auxiliary input of Lock in Amplifier 2 The nominal input range is 2 5 V peak to peak AC within...

Page 228: ... This is the auxiliary input of Lock in Amplifier 3 The nominal input range is 2 5 V peak to peak AC within the range of 10 V DC To use this input to Lock in 3 open the Advanced AC Mode Controls window select the Lock in 3 tab then select Aux from the Input dropdown menu This can also be used as an external input to the controller While this is in use it disables the normal outputs of the Lock in ...

Page 229: ...ifier 2 Input and 2 to the ASAB Lock in Amplifier 3 Input In PFM mode Lock in 2 drives the sample bias and monitors the deflection signal to measure the amplitude of the cantilever motion caused by the piezoelectric motion of the sample This motion is very small and often requires a very high gain before the lock in total Gain x1024 The bias voltage applied between the tip and sample is usually ve...

Page 230: ...implified Controls From the Mode menu select the imaging mode you wish to use PicoView will open a window with only the options required for that mode and will automatically adjust settings to typical values for that mode This is the way that you will most often use MAC III Advanced Controls The Controls Advanced AC Mode window displays all of the possible MAC III options This window is used to cr...

Page 231: ...dvanced AC Mode property sheet In this section we will describe the simplified controls for each mode Contact Mode Contact mode does not require any MAC III specific controls AC AFM In AC mode the drive signal can be provided by the MAC III controller To use the MAC III controller as the AC source choose Controls Setup Components then select the Serial Port AC Mode Controller check box The system ...

Page 232: ...n oscillating signal to drive the cantilever The Deflection channel is selected as the input for Lock in 1 during laser and detector alignment When an approach is initiated the input automatically switches to Amplitude The following parameters are available in the ACAFM Controls window Amplitude Displays the amplitude in volts of cantilever oscillation Drive The amplitude of the lock in drive sign...

Page 233: ...nterpret phase changes from the current value Q Control On By applying a phase shifted version of the cantilever deflection signal on top of the drive signal Q control can either increase or decrease the effective quality factor of the system Select this On check box to enable the Q Control feedback loop By default Q Control is turned Off Drive Sets the amplitude of the Q Control phase shifted sig...

Page 234: ...1 is used to oscillate the tip parallel to the sample surface with the Friction channel as its input The Drive Mechanism is set to AAC Cantilever deflection is controlled as in Contact Mode Choose Mode DLFM then choose Controls AC Mode to open the DLFM Controls window Figure 11 8 DLFM Controls window CAUTION The piezo element used to oscillate the cantilever in the DLFM nose assembly is partially ...

Page 235: ...is x1 the amplitude times 1 Zero Phase Sets the phase at the current frequency to zero making it easier to interpret phase changes from the current value Q Control On By applying a phase shifted version of the cantilever deflection signal on top of the drive signal Q control can either increase or decrease the effective quality factor of the system Select this On check box to enable the Q Control ...

Page 236: ...trols window In Force Modulation Mode Lock in 1 is enabled with the Deflection channel as its input The following settings are also available Amplitude Displays the amplitude in volts of cantilever deflection Drive The amplitude of the lock in drive signal stated as a percentage 0 100 of the maximum available 10 V Frequency kHz Displays the frequency of the lock in signal Gain Multiplies the outpu...

Page 237: ...shifted signal stated as a percentage 0 100 of the maximum available Optimize Sets the optimal Q Control Phase Shift and Drive On the Output tab the Pass Through check boxes for Deflection and Friction are selected passing these values from the microscope through to the AFM controller Amplitude 1 and Phase 1 are routed to the Aux 1 and Aux 2 outputs respectively to be used as inputs to image buffe...

Page 238: ... the Lock in 1 drive signal stated as a percentage 0 100 of the maximum available 10 V Frequency kHz Displays the frequency of the Lock in 1 signal From the AC Tune window you can sweep the frequency of Lock in 1 to determine the frequency at which the tip oscillation is maximized i e the resonant frequency Gain Multiplies the output of the lock in by the selected factor Use a larger multiplier to...

Page 239: ...able Optimize Sets the optimal Q Control Phase Shift and Drive The EFM tab shows the parameters for Lock in 2 Drive Frequency and Gain settings have the same functions as described for Lock in 1 in Lock In Tabs on page 25 As mentioned Lock in 2 is used as the source for the AC tip bias You will typically need to sweep the frequency of Lock in 2 to ensure that the electrical response of the cantile...

Page 240: ...w changes in the EFM signal choose Aux 1 in the Realtime Images window KFM In KFM Mode Lock in 1 is used to drive the cantilever with the Deflection channel as its Input Lock in 2 provides an AC tip bias also with the Deflection channel as its Input A DC bias is provided by an internal servo mechanism to counter electrostatic forces on the tip NOTE For KFM mode the Bias switch on the back of the H...

Page 241: ...hows settings for Lock in 1 and Q Control Amplitude Displays the amplitude in volts of cantilever oscillation amplitude Drive The amplitude of the Lock in 1 drive signal stated as a percentage 0 100 of the maximum available 10 V Frequency kHz Displays the frequency of the Lock in 1 signal From the AC Tune window you can sweep the frequency of Lock in 1 to determine the ...

Page 242: ...er deflection signal on top of the drive signal Q control can either increase or decrease the effective quality factor of the system Select this On check box to enable the Q Control feedback loop By default Q Control is turned Off Drive Sets the amplitude of the Q Control phase shifted signal stated as a percentage 0 100 of the maximum available Optimize Sets the optimal Q Control Phase Shift and ...

Page 243: ...ximize contrast The output from the servo is routed to the SP Channel and to the Drive Offset of Lock in 2 To map the output which is the KFM signal choose SP in the Realtime Images window I Gain and P Gain are the Integral and Proportional Gains for the MAC III internal servo loop Set the I and P Gains to obtain the sharpest image in the Realtime Images window X Component 2 and Phase 2 are routed...

Page 244: ...e Controls window Lock in tab Amplitude Displays the amplitude in volts of whatever is being driven by the lock in drive For example if the lock in is driving the cantilever the oscillation amplitude as measured by the photo detector is reported Drive The amplitude of the Lock in 1 drive signal stated as a percentage 0 100 of the maximum available 10 V Frequency kHz Displays the frequency of the L...

Page 245: ...andwidth based on the Input signal Input The source signal that is routed to the input of the lock in Choosing Aux will route the signal from the MAC III controller s AUX connector to the lock in input The default Input is the cantilever Deflection Phase Offset Applies an offset to the calculated phase signal The value stated in degrees is 0 by default however it can be adjusted such that the calc...

Page 246: ...ct to the drive signal they will remain orthogonal to each other This feature is useful for example to maximize the real component of the drive signal in KFM mode The default value is 0 Phase Compensation Phase Compensation adds a frequency dependent phase offset to compensate for any phase shifts in the electronics Sum External Drive Select this check box to add a signal from the ASAB External Dr...

Page 247: ...ut value is overridden Outputs Tab The Output tab options set the routing paths between the MAC III physical and internal connections Figure 11 13 Advanced AC Mode Controls window Outputs tab Drive Out Routes the output from one of the three lock in signals to the circuit controlling oscillation of the cantilever either AAC or MAC depending on your setup Set this option to GND to turn off the outp...

Page 248: ...directly to the microscope These are the default settings Tip Bias The Tip Bias is also set under the Main tab of the Servo window and by default sent from the AFM controller to the microscope The choice between Tip or Sample bias is made under the Advanced tab in the Servo window This option allows you to add the signal from one of the MAC III lock ins to the Tip Bias or to replace the Tip Bias c...

Page 249: ...troller includes seven outputs Deflection Friction SP AUX 1 4 that are routed to the AFM controller for imaging Each output can carry one of thirteen signals the Amplitude Phase X Component or Y Component of the three lock in signals or the output of the MAC III internal servo Selecting GND for any output sets its output to 0 By default the Deflection output carries Amplitude 1 the amplitude of Lo...

Page 250: ...C or Top MAC I Gain The Integral Gain to the MAC III internal servo loop The default value is 0 P Gain The Proportional Gain to the MAC III servo The default value is 0 Setpoint V The voltage which the servo will try to maintain Input Routes the Amplitude Phase X Component or Y Component from the three lock in signals to the MAC III servo input This is the signal that the servo will maintain at th...

Page 251: ... check box to enable the Q Control feedback loop By default Q Control is turned Off Drive Sets the amplitude of the Q Control phase shifted signal stated as a percentage 0 100 of the maximum available Phase Shift Shifts the Q Control feedback signal with respect to the input Sweep Selects the lock in for which the frequency will be swept on the AC Tune window Only one lock in can be swept at a tim...

Page 252: ...lation FM to track the surface potential The second operation is referred to as FM mode An optional signal access box is available for MAC III to allow custom multi frequency experimentation like KFM FM mode The box is shown in Figure 11 4 on page 7 and described in Table 4 on page 7 The auxiliary inputs and drive outputs are accessible through the MAC III Auxiliary Signal Access Box ASAB The soft...

Page 253: ...in the effective free resonance of the cantilever caused by an electrostatic force gradient The output of the second lock in amplifier can be used as an input to the KFM servo used to null the electric field between the tip and sample The third lock in amplifier can be used for tuning the operational parameters for recording the second harmonics of the electrostatic force gradient modulation which...

Page 254: ...from the sample to the clamp For tuning a KFM probe Autotune can be performed from the KFM mode environment For AM mode it is generally beneficial to tune the cantilever below the resonant frequency For FM mode better results are achieved tuning the cantilever 200 300 Hz above the resonant NOTE It is recommended that the sample be grounded This can be done using a small piece of wire to connect th...

Page 255: ...uses amplitude modulation AM to track the surface while the KFM servo uses amplitude modulation to track the surface potential This first operation is referred to as AM mode In the second operation the topography servo uses amplitude modulation to track the surface while the KFM servo uses frequency modulation FM to track the surface potential The second operation is referred to as FM mode and is ...

Page 256: ...e image 3 Set parameters in the KFM tab as shown in Figure 11 18 for initial settings Figure 11 18 KFM tab initial settings left for AM mode operation Settings on the right are after the Drive check box has been selected and the Optimize button has been clicked 4 Select the Drive check box This will turn on the AC bias to the tip If the Amplitude 2 parameter in the lower portion of the KFM tab is ...

Page 257: ...ng below c Clear the Servo On check box and increase the Drive Click the Optimize button and select the Servo On check box Check for SP stability 7 In the Realtime Images window add another imaging channel with the button At the top of the new window select SP as the input 8 If desired another window can be opened and qualitative mapping of dC dZ handled by Lock In 3 can be performed Note that dC ...

Page 258: ...w the SP responds to changing tip height To check this go to the Spectroscopy window which should be set to Amplitude vs Distance and open another channel to observe SP Run an infinite number of sweeps over a very small distance range and observe how SP changes with distance If SP is sloped then adjust the KFM Servo Setpoint slowly until it is horizontal Figure 11 19 shows the SP sweep before and ...

Page 259: ...Setpoint adjustment Setting Parameters for FM Mode Operation KFM imaging in FM mode requires the use of the auxiliary signal access box ASAB Connect the ASAB to the controller as shown in Figure 11 5 on page 9 The ASAB is connected to the auxiliary serial port on the back of the MAC III A BNC cable should connect the ...

Page 260: ...o to the input of Lock in 3 Choose Mode KFM FM then choose Controls AC Mode to open the KFM Controls window Once the tip is engaged on the surface of the sample and topography imaging is optimized the KFM Controls window can be used to optimize the KFM parameters The default parameters for FM are shown in Figure 11 20 Figure 11 20 KFM tab initial settings for FM mode operation ...

Page 261: ...lick the Optimize button and select the Servo On check box Check for SP stability b Clear the Servo On check box and increase the Drive Click the Optimize button and select the Servo On check box Check for SP stability 4 In the Realtime Images window add another imaging channel with the button At the top of the window select SP as the input 5 If desired another window can be opened and qualitative...

Page 262: ...ct mode and requires a SPM probe that is coated with a conductive material An AC modulation with an optional DC offset bias is applied to the tip which is in contact with the sample surface and the piezoresponse of the sample is measured from the deflection of the cantilever PFM Spectroscopy is a non imaging technique that compliments PFM imaging In PFM Spectroscopy the piezoresponse of a given lo...

Page 263: ...ssemblies are recommended for imaging in liquid because the smaller angle takes into account the different angle the laser makes as it goes in and out of the fluid compared to operation in air A Top MAC nose assembly is available with an eight degree nose assembly option Figure 12 1 shows the components of the liquid cell two retaining clips an O ring gasket and the liquid cell plate Figure 12 2 s...

Page 264: ...tandard Sample Plate One challenge with using the liquid cell is to locate the region of interest through the liquid It is typically easier to first locate the dry sample and then to add the liquid as follows 1 Prepare and place the sample on the sample plate 2 Place the sample plate on the microscope 3 Using the Close switch on the Head Electronics Box and watching the video system roughly approa...

Page 265: ... the groove in the pin Repeat for the other pin The liquid cell is now firmly attached and sealed to the sample plate 12 Add the appropriate liquid to the cell Use enough liquid to submerge the sample but not so much that the liquid rises to the top of the cell This will prevent spillage as the scanner moves into the cell 13 Replace the sample plate on the microscope 14 Move the scanner down the s...

Page 266: ...cribed above However the MAC mode sample plate contains a ferrite core that can react when placed in solution or in contact with the sample Therefore a cover slip should be placed over the core and the sample placed on the cover slip to ensure that the core does not contact the sample or liquid Flow Through Liquid Cell A liquid cell is also available with connections allowing liquid to flow contin...

Page 267: ... Imaging 13 21 Tips for Temperature Controlled Imaging 13 22 Several temperature control sample plates are available for use with the Keysight 5500 SPM With temperature control studies can be done while maintaining physiological temperature for melting experiments etc Cantilevers for Temperature Controlled Imaging Uncoated silicon cantilevers are recommended for imaging under temperature control C...

Page 268: ...ging High Temperature Sample Plates Two high temperature sample plates are available The standard hot sample plate Figure 13 1 provides a temperature range from ambient to 250 C Figure 13 1 5500 standard hot sample plate The Hot MAC sample plate Figure 13 2 provides temperatures from ambient to 110 C and enables imaging in MAC Mode Figure 13 2 5500 hot MAC sample plate ...

Page 269: ...e Control 5 Keysight 5500 SPM User s Guide 5 3 Sample plates from the 7500 and 9500 systems are compatible with the 5500 Figure 13 3 7500 9500 standard hot sample plate Figure 13 4 7500 9500 hot MAC sample plate ...

Page 270: ...oller Figure 13 5 drives the high temperature plates Note the temperature sensor type in the Lakeshore Control Setup menu should be set to 100W Plat 500 Figure 13 5 Lakeshore temperature controller CAUTION The ramping rate should be keep below 10 degrees per minute to avoid damaging the plate ...

Page 271: ...ctions Figure 13 6 shows the three cables included with both high temperature sample plates Figure 13 6 High temperature sample plate cables The Hot MAC sample plate also includes a Y connector for the MAC cable Figure 13 7 Figure 13 7 Hot MAC sample stage Y cable ...

Page 272: ...nd shown in Figure 13 9 Figure 13 8 Y cable for use with 7500 9500 sample plates Figure 13 9 shows the required wiring for the hot sample plate Figure 13 11 shows the wiring for the hot MAC sample plate The connection at the end of Cable 1 enables wiring to the temperature stages through a port in the environmental chamber Fold the straight ...

Page 273: ...Keysight 5500 SPM User s Guide 5 7 connector parallel to the cable and pass it through a port in the chamber Then screw the round connector into the port to make a tight seal Figure 13 9 5500 hot sample plate wiring diagram ...

Page 274: ...Temperature Control 5 Keysight 5500 SPM User s Guide 5 8 Figure 13 10 7500 9500 hot sample plate wiring diagram ...

Page 275: ...Temperature Control 5 Keysight 5500 SPM User s Guide 5 9 Figure 13 11 5500 hot MAC sample plate wiring diagram ...

Page 276: ...Temperature Control 5 Keysight 5500 SPM User s Guide 5 10 Figure 13 12 7500 9500 hot MAC sample plate wiring diagram ...

Page 277: ...ss the Heater Off button 5 Press Auto Tune then press the Up or Down arrow buttons until the display read Tune Manual 6 Set the Proportional Integral and Differential gains Typical values are 20 20 and 100 respectively 7 Press Setpoint and enter a value slightly lower than room temperature 23 C Wait for the setpoint value to stabilize 8 Set the Ramp Rate to no more than 10 degrees per minute 5 deg...

Page 278: ...rature to stabilize 12 Initiate an approach 13 Image as usual Imaging during temperature ramp is possible provided care is taken to compensate for sample thermal expansion Monitor the Z piezo position as the temperature increases to determine if when it goes out of range CAUTION Do NOT use the High setting with a Peltier cooling plate see below ...

Page 279: ...t AAC MAC or STM Modes at controlled temperatures below or near ambient temperature Figure 13 14 The 1X Peltier plate provides a temperature range of 5 to 40 C Figure 13 14 Peltier Cold MAC sample plate Sample plates from the 7500 and 9500 systems are compatible with the 5500 system Figure 13 15 7500 9500 Peltier Cold MAC sample plate bottom view ...

Page 280: ...er Figure 13 5 on page 4 is also used with the Peltier plate The current booster Figure 13 16 is used to drive the Peltier sample plate temperature The booster includes a safety device that shuts off the power if the reverse side of the Peltier becomes excessively hot Figure 13 16 Current booster ...

Page 281: ...nnections Figure 13 17 shows the three cables included with the Peltier sample plate Figure 13 17 Peltier sample plate cables The Peltier sample plate also connects to MAC cables for use with MAC Mode Figure 13 18 Figure 13 18 MAC cable for Peltier sample plate ...

Page 282: ...ng the 7500 9500 sample plates an updated Y cable is included and shown in Figure 13 19 Figure 13 19 Y cable for use with 7500 9500 sample plates Figure 13 20 shows the required wiring for the Peltier sample plate MAC Mode is optional and the figure below shows the setup with the ...

Page 283: ...ht 5500 SPM User s Guide 5 17 MAC Mode option The connection at the end of Cable 1 enables wiring to the temperature stages through a port in the environmental chamber Figure 13 20 5500 Peltier Cold MAC sample plate wiring diagram ...

Page 284: ...Temperature Control 5 Keysight 5500 SPM User s Guide 5 18 Figure 13 21 5500 Peltier Cold sample plate wiring diagram ...

Page 285: ...Temperature Control 5 Keysight 5500 SPM User s Guide 5 19 Figure 13 22 7500 9500 Peltier Cold MAC sample plate wiring diagram ...

Page 286: ...rside of the Peltier sample plate to connect water cooling tubing A gravity fed water cooling system Figure 13 24 is preferred over mechanical pumping because it reduces the potential for vibration that can affect imaging Two reservoirs are provided with the Peltier sample plate one to be used as a source and the other as a receptacle to store water for recycling A height difference of three feet ...

Page 287: ...Down arrow buttons until the display read Tune Manual Press Enter 7 Set the Proportional Integral and Differential gains Typical values are 12 12 and 5 respectively 8 Press Setpoint and enter a value slightly lower than room temperature 23 C Wait for the setpoint temperature to stabilize 9 Set the Ramp Rate to no more than 10 degrees per minute 5 degrees minute is a typical ramp rate 10 Turn the R...

Page 288: ...d not be used to mount samples for temperature controlled experiments It is possible to ramp the temperature while imaging Use slow ramps typically less than 1 C per minute Every sample will react differently to temperature control A thin piece of graphite is a good test sample to use while setting up the temperature control system Temperature fluctuations due to excessive gains will cause the sur...

Page 289: ...l technique that can be used to quantify the elastic properties of materials or to measure single molecule unfolding or unbinding interactions on the picoNewton scale AFM probes are composed of flexible triangular or rectangular cantilevers with a sharp tip near the end of the cantilever They can be manufactured from a variety of materials but most AFM probes are made from silicon and or silicon n...

Page 290: ...uantify intra or inter molecular interactions or the compliance of materials with the AFM Nominal spring constant values are commonly reported by AFM probe suppliers However because of manufacturing variability the spring constants of individual cantilevers can vary greatly even between probes in the same batch or from the same wafer Consequently in order to accurately quantify material compliance...

Page 291: ...related to the force required to deflect the cantilever according to Hooke s Law For an ideal spring with a spring constant value of k the thermal noise according to its position allows the spring constant to be determined In principle simply measuring the deflection value of the cantilever and temperature would permit its spring constant to be calculated However an AFM cantilever is not an ideal ...

Page 292: ...ctroscopy to open the Spectroscopy window 3 In the Spectroscopy window confirm Force vs Distance for the plot type Figure 14 2 4 In the Spectroscopy Basic tab click on the 1 button to do a single sweep Figure 14 2 Spectroscopy window showing Force vs Distance selected NOTE In order to obtain accurate spring constant values with Thermal K the Z closed loop scanner is recommended Also in order to ma...

Page 293: ...the ruler line to move the second marker closer to the jump to contact point as shown below Figure 14 3 Force curve Deflection vs distance with ruler markers 7 Right click on the ruler after the end points are set and select Deflection Sensitivity Figure 14 4 to update the value in the Advanced tab Figure 14 4 Advanced tab in the Spectroscopy window 8 Click the Thermal K button in the Advanced tab...

Page 294: ...w the tip This will open the Thermal K plot window similar to that shown below Figure 14 5 Thermal K plot window 11 Set the parameters a Acquisition Time to 1 0 s b Averages to 10 c Chose the correct cantilever shape from the drop down menu d Temperature to the correct ambient temperature in Celsius 12 Click the Full button on the right side of the Thermal K window 13 Click the Plot button ...

Page 295: ...oll wheel can be used to zoom in the plot if needed Figure 14 6 Thermal K PSD plot with markers set to define frequency range 16 Click the Compute button PicoView will acquire the selected number of scans and will average the frequencies within the selected range to complete the calculation The Thermal K window will refresh showing the PSD across the frequency range and a best fit curve in red The...

Page 296: ...lcuation should converge to a value Using a small number of scans for this process lets you see how much the calculation is changing as you accumulate data 18 Once the Force Constant value is stable click the Apply button in the Thermal K window The Force Constant should now be updated in the Spectroscopy Advanced tab Change the plot window to display Force units if needed 19 In the Spectroscopy p...

Page 297: ...Thermal K 5 Keysight 5500 SPM User s Guide 5 9 Figure 14 8 Select units after calibrating the Force Constant ...

Page 298: ...al K 5 Keysight 5500 SPM User s Guide 5 10 Once the units have been selected measurements can be taken on subsequent force curves as shown in Figure 14 9 Figure 14 9 Force curve with calibrated measurements ...

Page 299: ...two other options are available to let you control the atmosphere for sample preparation and or imaging Environmental Chamber The environmental control chamber Figure 15 1 lets you isolate samples for imaging in a controlled atmosphere It can also provide excellent acoustic isolation and protection from air movement even when atmosphere control is not required The chamber operates at ...

Page 300: ...ample one gas port may be used to introduce a gas while another simultaneously vents the chamber i e when the gas cannot be safely vented directly into the lab One such example would be a non aqueous electrochemistry experiment requiring the saturation of an inert as with an organic solvent To use the chamber 1 Prepare the sample on a sample plate 2 Mount the sample plate on the microscope 3 Loose...

Page 301: ...ace oxygen from solutions used in electrochemistry experiments Good results have been obtained by first bubbling an inert gas nitrogen or argon through the solution to be placed into the liquid cell and then setting the environmental chamber up with a steady flow through rate of 1 to 2 SCFH When the microscope and environmental chamber are placed inside the vibration isolation chamber tubes and ca...

Page 302: ...n high 325 mm 12 8 in wide and 351 mm 13 8 in deep and can be used at temperatures below 0 C The gloves are heavy duty 15 mil Latex Figure 15 3 Glove Box The 5500 SPM mounts directly to the top of the box s stainless steel mounting plate with the stage motor screws and sample plate extending into the box ...

Page 303: ...r Electochemistry 16 10 SECM Scanning Electrochemical Microscopy 16 12 SECM System Setup 16 12 Assembling the SECM Nose Cone 16 14 SECM Software Interface 16 17 The electrical potential that exists across the interface between a metal surface and an electrolytic solution is known as the surface potential This is the driving force behind such processes as adsorption desorption and electron transfer...

Page 304: ...tions of reactants must be held constant at the electrode surface as is true when negligible current flows through the reference electrode Figure 16 1 shows a typical electrochemistry setup while Figure 16 2 shows that same setup created with the 5500 SPM liquid cell Note that electrochemistry experiments can be conducted using either AFM Modes or STM Mode Figure 16 1 Electrochemistry experiment s...

Page 305: ... The basic components are described below Liquid Cell The liquid cell described earlier in this manual enables imaging in a liquid Figure 16 1 The cell is 15 mm 0 59 in in diameter and seals over the sample with an o ring The sample surface must be very flat and larger than the diameter of the cell to avoid leakage Electrodes Three electrodes are typically required for electrochemistry experiments...

Page 306: ...s the sample through a separate access hole outside of the liquid cell chamber Since it is not in contact with the electrolyte it does not require special cleaning A wire made to the same dimensions can be used in place of the pogo Figure 16 3 Pogo electrode Reference Electrode The reference electrode RE should have a diameter of 0 51 mm 0 02 in It will sit within the electrolyte but will not cont...

Page 307: ...Thorough cleaning of all components will greatly improve the results of electrochemistry experimentation Suggestions for cleaning each component are given below Liquid Cell Cleaning The liquid cell should be cleaned prior to every use according to these instructions Non Critical Applications 1 Sonicate the liquid cell in laboratory detergent 2 Rinse in 18 MW cm water 3 Rinse in methanol 4 Blow dry...

Page 308: ...ce or electrolyte a general cleaning with methanol or ethanol prior to assembly is sufficient Substrate Cleaning Substrates should be free of surface contaminants Gold substrates should be hydrogen flame annealed prior to imaging for best results Assembling and Loading the Liquid Cell It is recommended that the assembly procedure be carried out in a laminar flow hood glove box or other clean envir...

Page 309: ... electrolyte but will not touch the sample substrate or each other 10 Use a multimeter to check for good conductivity between the reference electrode and sample plate clamp and between the counter electrode and sample plate clamp 11 With the multimeter verify that the reference and counter electrode are not shorted to another electrode or to the substrate 12 Verify that the AFM probe or STM tip wi...

Page 310: ...s not connected physically to ground 2 In AFM Mode the potential of the tip is determined by the setting of the switch on the back of the Head Electronics Box for conductive cantilevers a If the switch is set to WE then the cantilever is biased to the same potential as the working electrode sample substrate b If the switch is set to Tip then the cantilever is tied to the tip bias DAC output This i...

Page 311: ...stry window in PicoView Additional details regarding the menu toolbar and main tab features are in the online PicoView User Guide Choose Controls Electrochemistry from the PicoView main window or click on the Electrochemistry icon from the toolbar button to open the Electrochemistry window Figure 16 6 Figure 16 6 Electrochemistry window overview ...

Page 312: ...stry window 2 Select the Auto Set Potential check box 3 Click the CE button to turn the counter electrode On The button should be green 4 Set the Iec Gain from the drop down menu Initial values are typically 1 or 10 Note for older systems this is controlled from the HEB 5 Set the Sweep Sample Potential parameters These are sample dependent 6 Select sweeps for 1 cycle or continuous cycling 7 Once a...

Page 313: ...by choosing File Auto Save Every Experiment The title bar at the top of the window will indicate Auto Save is on circled in red in Figure 16 8 It will also be indicated by a check mark next to Auto Save in the Electrochemisty File menu Figure 16 8 Auto Save turned on for Electrochemistry experiments ...

Page 314: ... 5500 and 7500 AFM systems Figure 16 9 Block diagram of combined AFM SECM system The control of the sample potential is optional If necessary it can be controlled using the built in bipotentiostat as illustrated SECM System Setup The combined AFM SECM setup is illustrated in Figure 16 9 and consists of the following components Multipurpose AFM Scanner AFM Controller and Head Electronics Box HEB Mi...

Page 315: ...pin cable Figure 16 10 SECM Adapter left and adapter connected to AFM Base right 3 Assemble the 5500 SECM nose cone details below 4 Insert assembled nose cone into scanner 5 Mount the scanner in the base and align the laser to the cantilever and detector in air again just as in standard Contact mode 6 Assemble the EC cell as described in Assembling and Loading the Liquid Cell above Ensure there is...

Page 316: ...d probe cartridge The procedure to assembly the SECM nose cone is as follows 1 Strip the Teflon from the last 1 8 of the thin platinum Pt wire that is attached to the probe This enables the electrical contact between the probe and the EC electronics 2 Carefully hold the cartridge and slide it into the nose cone aligning the platform holding the probe with the slot in the nose cone as seen in Figur...

Page 317: ...hrough hole in nose cone NOTE The wire is insulated with a thin Teflon coating Be careful not to damage the coating as a large leakage current could result leading to an inability to run SECM experiments 4 Position the end of the wire between the base contact and set screw in the nose cone as seen in Figure 16 13 Figure 16 13 Arrow indicates point of contact for probe wire ...

Page 318: ...500 SPM User s Guide 5 16 5 Use the supplied Allen key to tighten the set screw from the bottom of the nose cone ensuring that secure contact is made with the wire Figure 16 14 Using Allen key to secure wire to contact in nose cone ...

Page 319: ... here Figure 16 15 PicoView Electrochemistry user interface For an SECM experiment the tip is always connected as one electrode The sample potential however can be either floating or controlled by the potentiostat A typical experiment would be to sweep the tip potential run CV on the electrode then set the tip potential to a proper ...

Page 320: ... redox reaction and run SECM imaging The sample potential can be set to a constant potential during the experiment if it is connected For such experiment the sweep potential in the control window above should be set to tip and the fixed potential should be set to Sample ...

Page 321: ...ht 5500 SPM with MAC Mode Controller A 3 Keysight 5500 SPM with MAC Mode Force Modulation Imaging A 4 Keysight 5500 SPM with MAC III Option A 5 Keysight 5500 SPM with MAC III Option and Closed Loop Scanner A 6 The following pages contain wiring diagrams for several common configurations of the Keysight 5500 SPM ...

Page 322: ...Wiring Diagrams 5 Keysight 5500 SPM User s Guide 5 2 Keysight 5500 SPM Standard Wiring Diagram Figure A 1 Wiring diagram for Keysight 5500 standard configuration ...

Page 323: ...Wiring Diagrams 5 Keysight 5500 SPM User s Guide 5 3 Keysight 5500 SPM with MAC Mode Controller Figure A 2 Wiring diagram for Keysight 5500 SPM with MAC Mode Option ...

Page 324: ...ing Diagrams 5 Keysight 5500 SPM User s Guide 5 4 Keysight 5500 SPM with MAC Mode Force Modulation Imaging Figure A 3 Wiring diagram for Keysight 5500 SPM with MAC Mode Option Force Modulation imaging mode ...

Page 325: ...Wiring Diagrams 5 Keysight 5500 SPM User s Guide 5 5 Keysight 5500 SPM with MAC III Option Figure A 4 Wiring diagram for Keysight 5500 SPM with MAC III Option ...

Page 326: ... Diagrams 5 Keysight 5500 SPM User s Guide 5 6 Keysight 5500 SPM with MAC III Option and Closed Loop Scanner Figure A 5 Wiring diagram for Keysight 5500 SPM with MAC III Option and Closed Loop Scanner option ...

Page 327: ...ode 1 12 7 9 Current booster 13 14 Current Sensing AFM 1 12 7 9 D Deflection 1 4 1 7 5 8 Deflection signal 4 24 Desiccator 8 4 Detector 1 6 2 9 Alignment 4 22 Gain switches 4 23 DLFM Mode 7 14 Dynamic Lateral Force Microscopy 7 14 E EC MAC cable 4 28 6 11 7 7 7 11 10 3 16 7 EFM Mode 7 25 7 29 11 18 Elasticity 1 3 1 13 Electrochemistry 15 3 16 1 Cleaning 16 5 Liquid cell 16 3 16 4 16 8 Electrode 7 ...

Page 328: ...1 6 10 6 14 10 1 Cables 10 2 Components 10 1 MAC option 10 1 Sample setup 10 4 Top MAC option 10 1 With liquid cell 12 4 MAC Mode controller 1 11 1 12 1 15 1 16 6 1 6 9 7 16 10 1 10 2 10 4 Magnetic AC Mode 1 11 6 1 Magnetic Force Microscopy 7 19 Manual Tune 7 15 Math plug in 7 36 7 41 MFM 7 19 Multi purpose Scanner 7 2 7 9 7 16 8 4 8 8 N Nano manipulation 1 4 Non linearity 8 5 8 10 8 14 Nose assem...

Page 329: ...n Multiplier 8 19 STM scanner 7 2 STM scanner inserting a tip 7 6 Scanning Probe Microscopy 1 3 Scanning Tunneling Microscopy 1 5 7 1 Sensitivity 8 5 8 13 8 16 8 18 9 2 Servo 9 1 Servo Gain Multiplier 8 19 Servo window 5 6 Setpoint 5 4 5 5 5 8 6 8 7 8 7 11 7 15 7 27 Optimizing 5 9 Size 5 7 Spectroscopy 7 30 Speed 5 7 Spring key 4 6 STM Mode 1 5 7 1 16 2 Constant current 1 5 Constant height 1 5 Sto...

Page 330: ...Keysight Technologies 5500 SPM User s Guide Part Number N9410 90001 Revision H Keysight Technologies 2015 ...

Reviews: