5 Commissioning
11.03
5.5 Diagnostics
© Siemens AG 2003 All Rights Reserved
5-304
SINUMERIK 840D/SIMODRIVE 611 digital SINUMERIK Safety Integrated (FBSI) - Edition 11.03
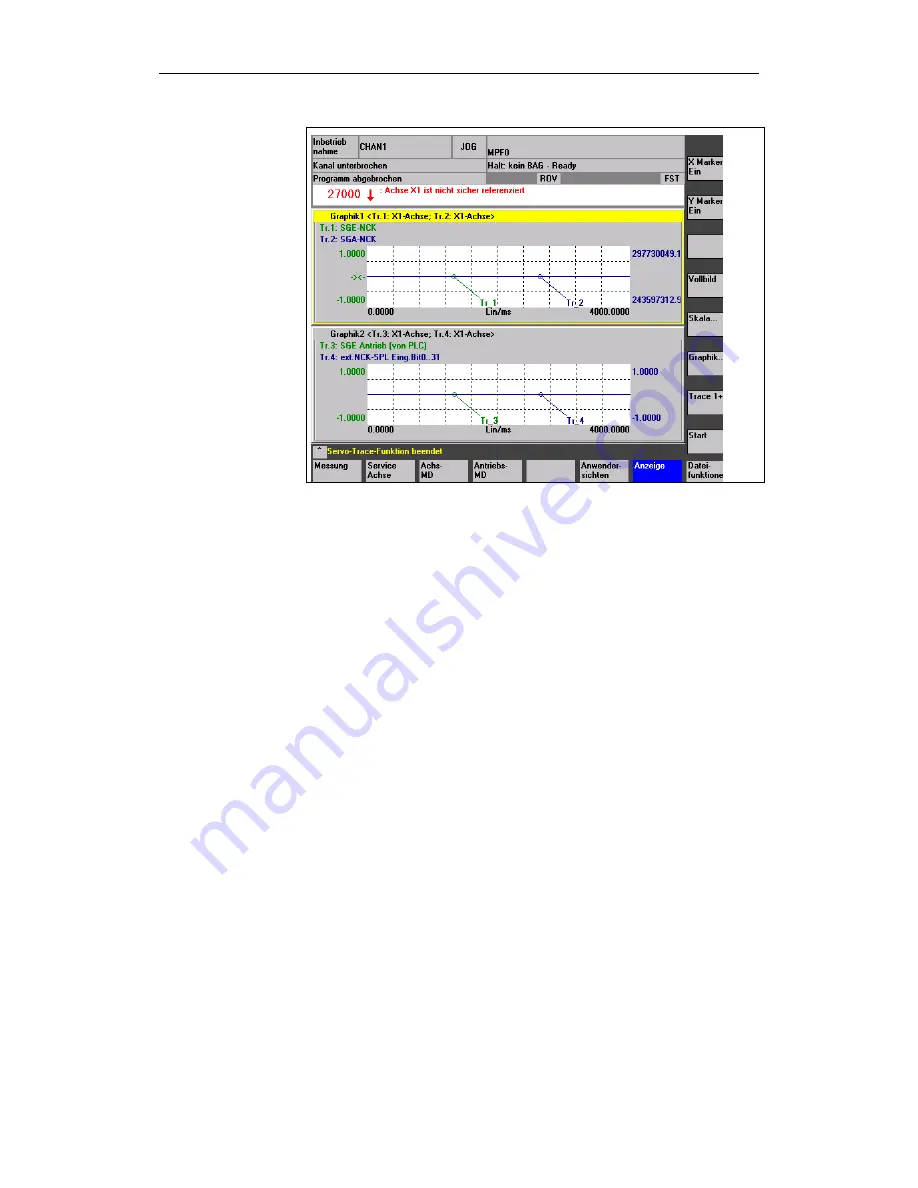
Two graphics (graphic 1 and graphic 2) are displayed. Each graphic can
include up to two measured value curves that are color-coded (trace 1 in
graphic 1: green, trace 2 in graphic 1: blue, trace 3 in graphic 2: green, trace 4
in graphic 2: blue).
Trace 1 and trace 2 are displayed in graphic 1, trace 3 and trace 4 in graphic 2.
The X axis of the graphics is the time axis and the Y axis is scaled in the
physical units of the particular signal. The title lines of the graphics indicate
(Tr.1 :X1 axis) that the measured values come from an actual measurement.
The parameterization of the measurement can be seen from the basic screen
of the servo trace (this can be accessed using the horizontal "measurement"
softkey).
Measurement settings and the measured values of the servo trace functions
can be saved, downloaded or deleted using the horizontal "file functions"
softkey. A detailed description will not be provided here. More detailed
information can be found in the following document
References:
//IAD//, Start-up Guide, SINUMERIK 840D, Chapter 10
5.5.4
Bit graphics for SI signals in the servo trace
Using the expansion of the servo trace, individual bits can be selected from bit-
coded SI signals and the characteristic over time can be graphically displayed
similar to a logic analyzer. Bit characteristics can be displayed as a function of
time for 10 character channels (tracks).
The bit-coded SI signals are principally sub-divided into two groups:
Graphic
File functions
Bit-coded SI signals


