


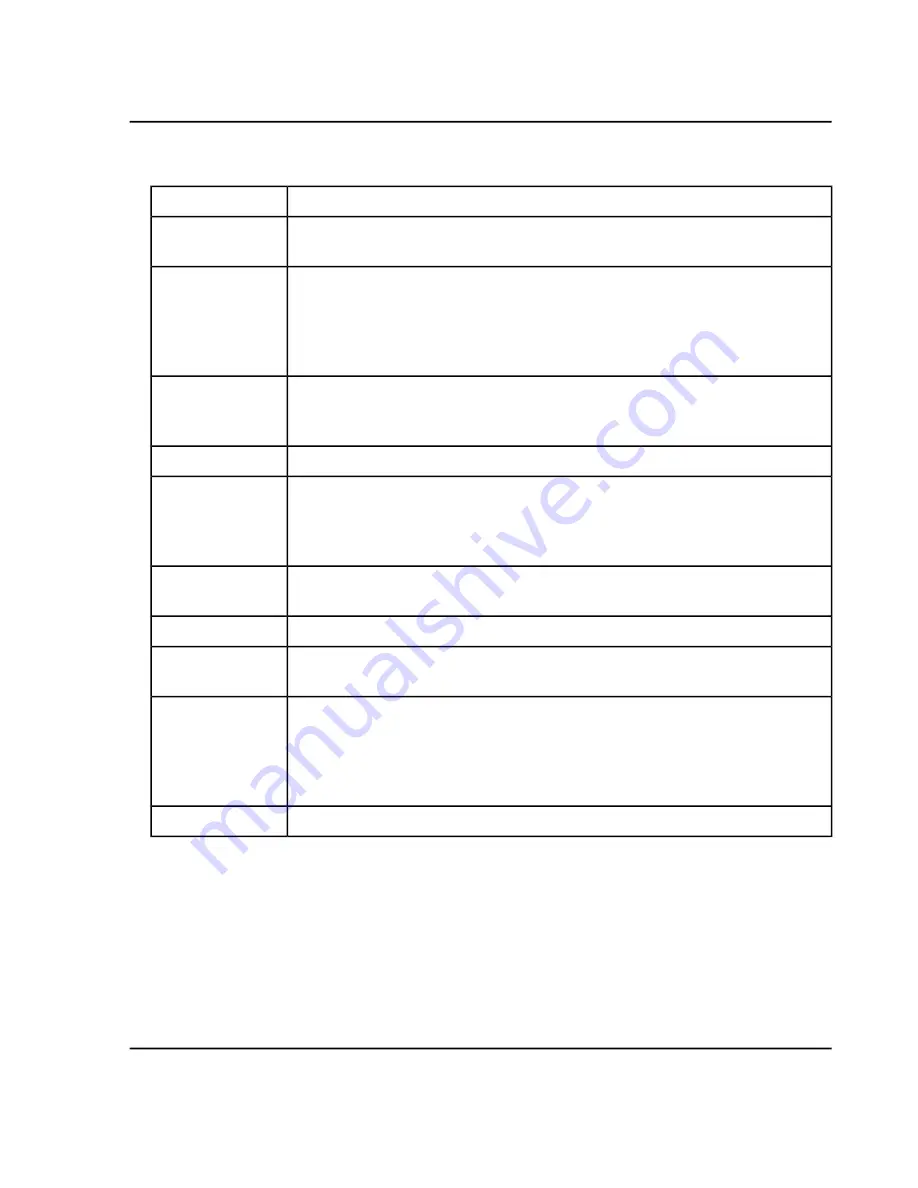
Table 6-25 Metric Plot Right-Click Menu Options
Description
Menu Option
Use the dialog to select the regression model. Refer to the Help system for more
information.
Regression
When this option is selected, plots values that are not numerical using a y-value of
zero. Otherwise, such points are omitted from the plot. For example, the
Retention
Time
is reported as N/A for peaks that could not be integrated. For this feature, a point
is present for such peaks so that the user can see these potentially problematic samples
and then link them to the
Peak Review
pane by clicking the point.
Display “N/A” as 0.0
Changes whether the data points are labeled using the text from the
Sample Name
field of the
Results Table
. If there is more than one overlaid trace, then only the
currently active trace is labeled.
Show sample names
Changes the legend that annotates the point symbols used for the various sample types.
Show legend
Changes whether the y-axis uses absolute units or a percentage of the maximum y-value.
When using the percentage feature, the percentage is calculated independently for
each overlaid trace. This feature can be used to plot overlaid traces for multiple
components and the response for the metric for the components is significantly different.
Use percent Y-axis
Changes whether the y-axis starts at y=0 or at the minimum y-value needing to be
plotted.
Start Y-Axis at zero
Changes whether the data points are connected by lines.
Connect with lines
If the plot is currently associated with a setting, then this feature saves the current
features. Otherwise, this feature behaves the same as the
Save Setting As
feature.
Save setting
If the same columns are frequently plotted, then the user can save the plotting options
as a setting. This enables the user to quickly generate a plot even if the required columns
are not currently visible in the
Results Table
. In addition to the columns, the various
plotting options are saved. After a setting is saved, the name is shown in the
Metric
Plot
menu.
Save setting as
If the current plot is associated with a setting, then use this feature to delete the setting.
Delete setting
Metric Plot Tips
• If users left-click on a data point, then the corresponding row of the Results Table is automatically selected
and scrolled into view. If the Peak Review pane is open, then it also updates to show the corresponding
chromatogram. This provides a convenient means of performing peak review for outliers.
System User Guide
SCIEX X500 QTOF System
RUO-IDV-05-2334-E
182 / 234
Operating Instructions—Software


