Description
Label
Item
Opens the Offset Traces dialog. Use this option to create a
three-dimensional stacked graph from a series of overlaid graph
traces.
Offset Traces in X and Y
16
Use this option to remove the generated offsets from the TIC.
Remove XY Offset
17
Use the Two-Pane Operation Tools
1. Open the Explorer workspace.
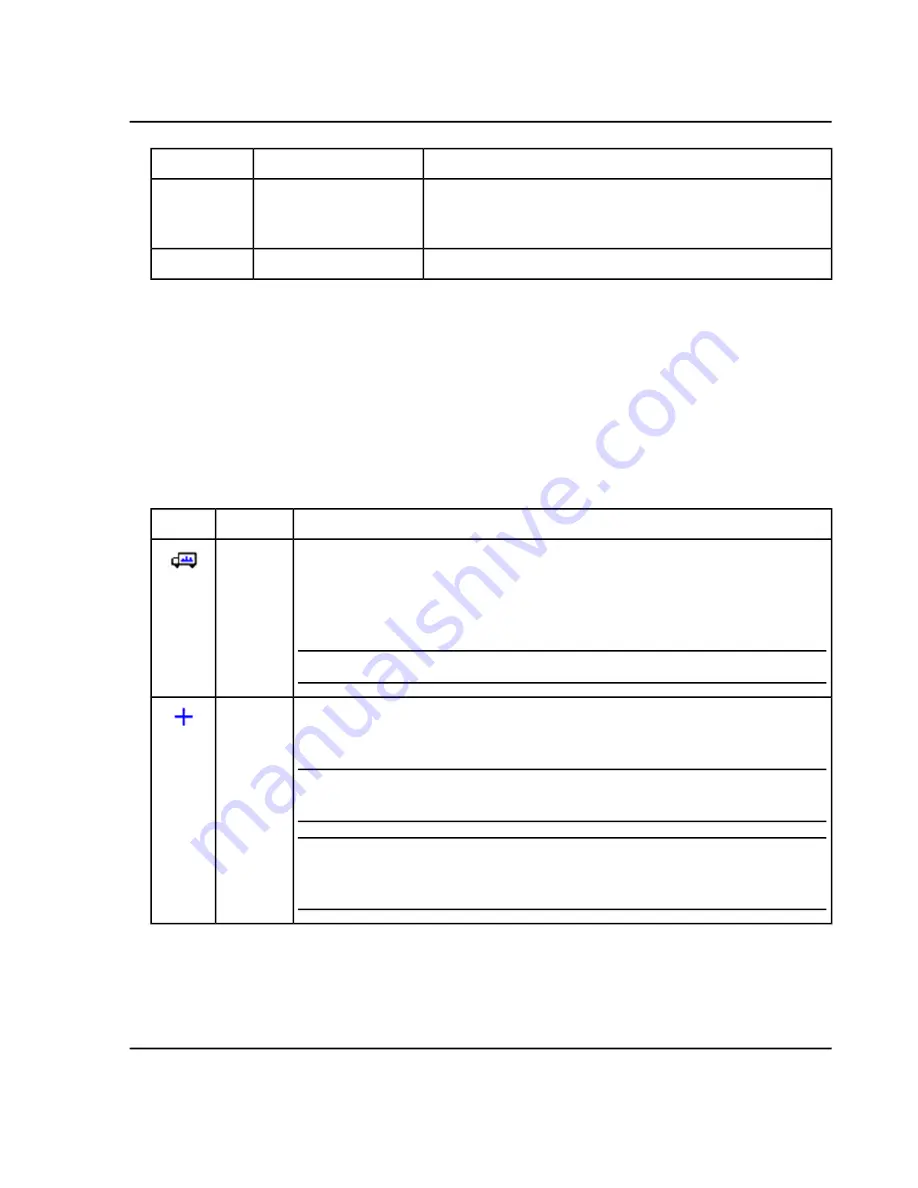
2. Use the icons along the right edge of panes (refer to
) to perform operations on two panes, the
source pane and the target pane. In all cases, click the icon in the source pane and then drag it to the target
pane.
Table 6-13 Two-Pane Tools
Description
Name
Icon
Shown in the top right corner of each pane. It changes the relative positions of the
panes. Click the icon in one pane and then drag it to the top, bottom, left, or right
portion of a second pane. Depending on where the cursor is released, the first pane
changes positions relative to the second. As the user drags the pane, one side of the
second pane is highlighted in red to indicate where the first pane will be placed.
Note:
The user can also drag panes from one window to another.
Move Pane
Used to sum two data sets together point-by-point. The data from the source pane
that was originally clicked is added to the target pane (the pane over which the icon
is released). The title of the modified pane updates to indicate that it has been modified.
Note:
Only to add two data sets of the same type can be added. For example, the
user cannot add a spectrum to a chromatogram.
Tip!
If the target graph contains more than one overlaid trace, then by default, the
source data is added to the active target data only. Hold the
Ctrl
key to add the
source to all data sets in the target pane.
Add Data
System User Guide
SCIEX X500 QTOF System
RUO-IDV-05-2334-E
128 / 234
Operating Instructions—Software


