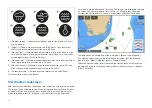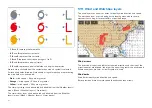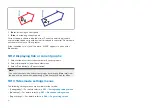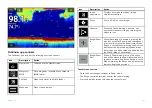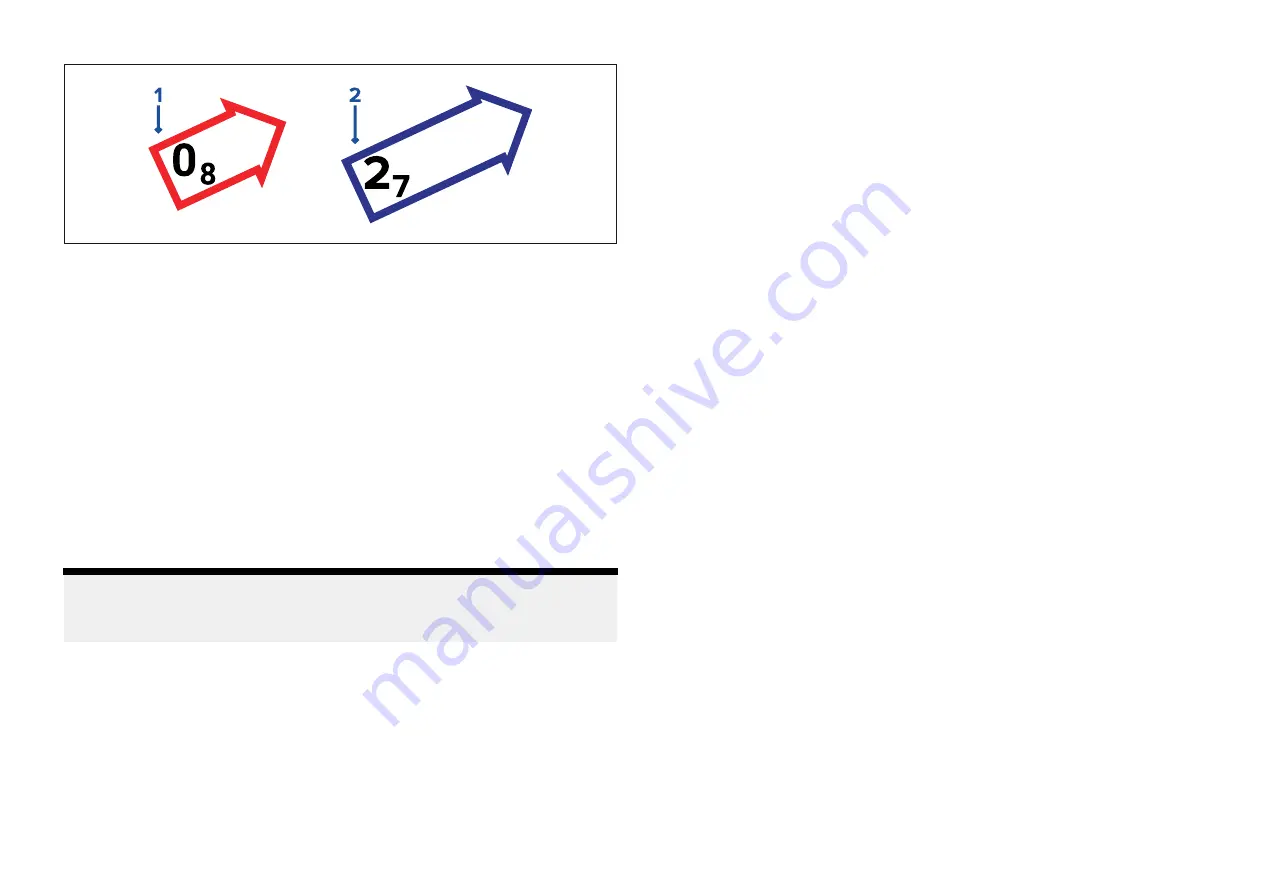
1.
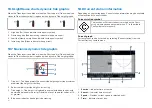
Red
= increasing current speed.
2.
Blue
= decreasing current speed.
Current speed is shown inside the arrow. Current speed is displayed in
user-selected speed units, with decimals displayed in subscript. Decimals are
not shown for values of 10 or greater.
If tidal conditions are “slack”, the word “SLACK” appears in a box with a
Blue border.
18.12 Displaying tide or current graphs
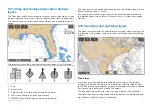
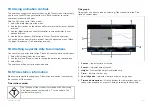
1. Select a tide or current station symbol or dynamic graphic.
2. Select
[more options]
from the context menu.
3. Select
[Tide station]
or
[Current station]
Note:
You can also access tide and current graphs by selecting
[More info]
from
the pop-over options when performing a
[Find nearest]
search for tides.
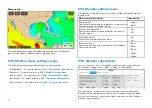
18.13 Tides mode settings menus
The following settings menus are available in tides mode:
•
[Cartography]
— For details refer to:
p.201 — Cartography settings menu
•
[Advanced]
— For details refer to:
p.207 — Advanced settings menu
•
[Page settings]
— For details refer to:
252
Содержание LIGHTHOUSE 4
Страница 2: ......
Страница 4: ......
Страница 20: ...APPENDIX C HARDWARE AND SOFTWARE COMPATIBILITY 478 APPENDIX D DOCUMENT CHANGE HISTORY 480 20...
Страница 414: ...414...
Страница 451: ...4 Select Delete again to confirm 5 Select OK YachtSense ecosystem 451...
Страница 484: ......
Страница 503: ......

