9-13
IM AQ1300-01EN
Performing RFC2544 Measurements (AQ1300 Option)
3
2
1
4
5
6
7
8
9
10
11
12
13
14
15
16
App
Index
9.7 Displaying
Packet Jitter Test Results
Procedure
Packet Jitter Test Results Screen
Follow the procedure in section 9.1 to start and stop measurement.
Press the
Packet Jitter
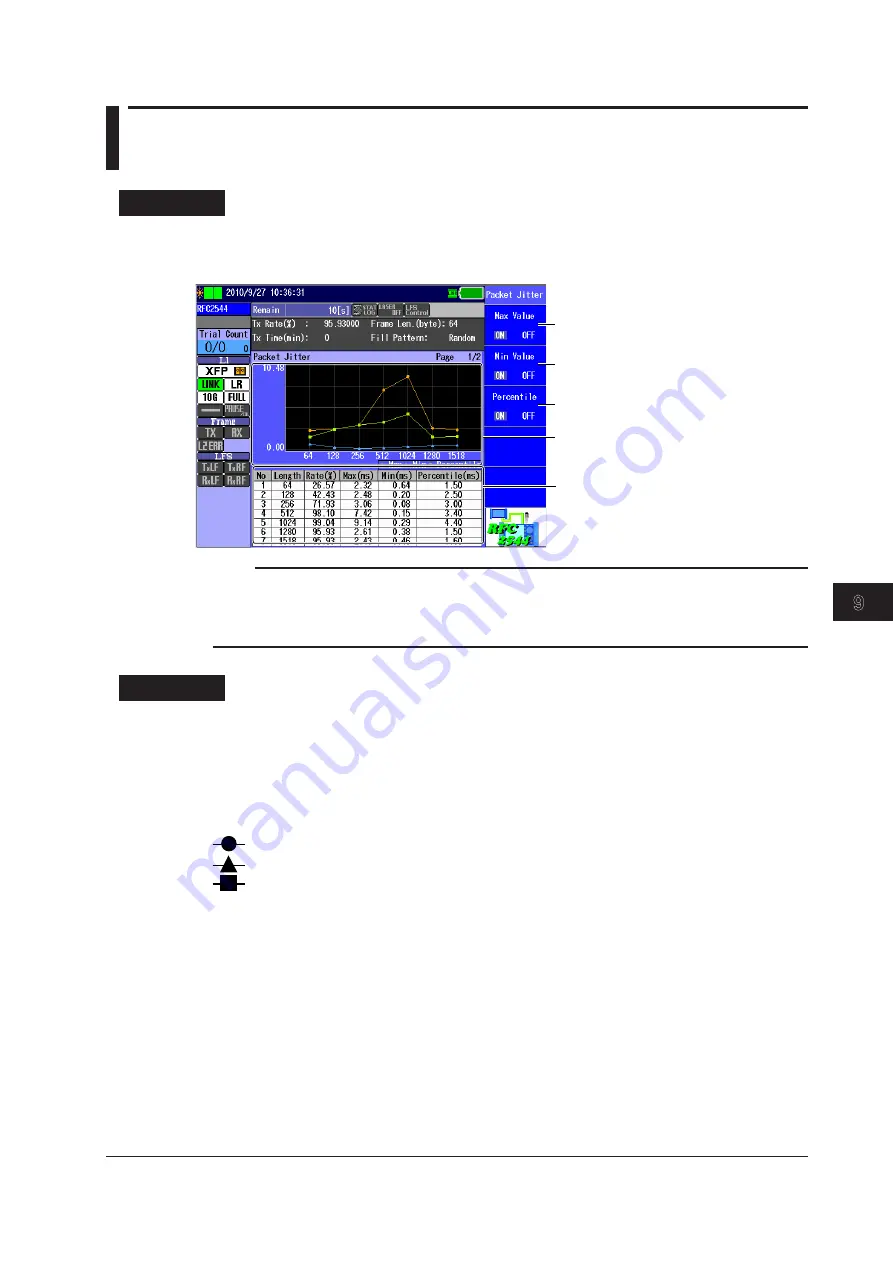
soft key to display the following screen.
Packet jitter test results graph
Packet jitter test results table
Set whether the maximum value graph is
displayed (ON, OFF).
Set whether the minimum value graph is
displayed (ON, OFF).
Set whether the percentile graph is
displayed (ON, OFF).
Note
• You can display this screen even during measurement.
• You can also use the left and right arrow keys to switch between measurement screens. For details, see
section 9.8.
• Press ESC to return to the Test Result Display screen (see section 9.2).
Explanation
Packet Jitter Test Results Graph
The measured results are displayed on a graph.
• Horizontal axis: Test frame length
• Vertical axis:
Delay variation
Three types of graphs are displayed: a graph that displays maximum values of delay variations, a
graph that displays minimum values of delay variations, and a graph that displays percentile values.
(maximum values): The maximum measured delay variations are displayed.
(minimum values): The minimum measured delay variations are displayed.
(percentile values): The statistically processed values (percentiles) of the measured delay
variations are displayed.
Packet Jitter Test Results Table
The following items are displayed.
• No: This is the test frame length number. If pass/fail judgment is enabled, the pass/fail
judgment results are indicated with colors for each frame length.
Green: Pass
Red: Fail
• Length: Test frame length
• Rate(%): Test rate (%)
• Max(ms): Maximum delay variations
• Min(ms): Minimum delay variations
• Percentile(ms): Percentile value of the delay variations


