6
Monitoring SAN Router Operation and Connections
6-7
Using the Element Manager Tools
Operational Status
LEDs on the Device View indicate status of system components.
Performance
The bars below each port number indicate the average percentage of
port bandwidth used on the previous poll cycle. The top bar
represents packets received (RX); the bottom bar represents packets
transmitted (TX). To view the performance bar tooltip, just position
your pointer over the bar and pause (
Figure 6-7
).
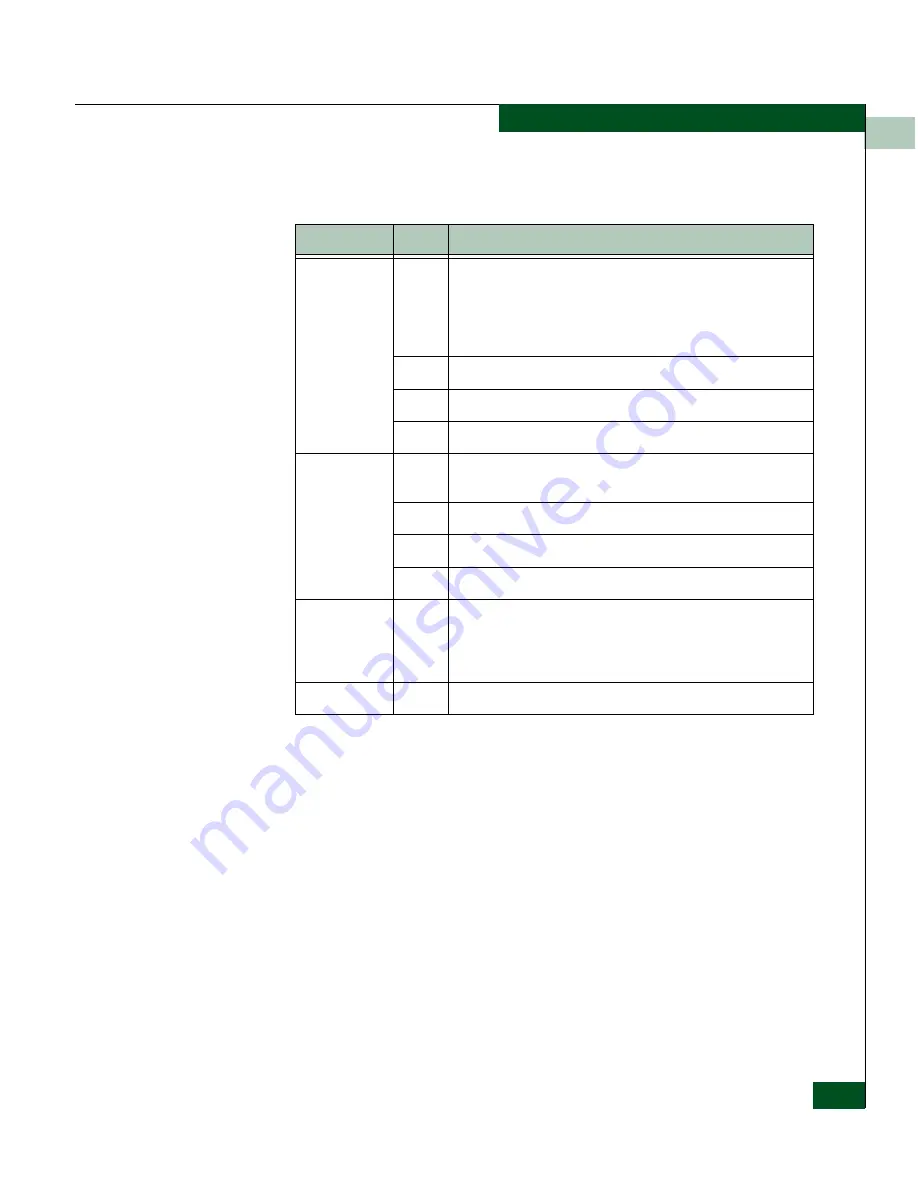
Table 6-3
System Status LEDs
LED Label
Color
Meaning
Power
Supplies
The colored borders around the two icons labeled Power
Supplies monitor the two power supplies. If green, good DC
power is being provided by the respective power supply. If a
power supply icon border is red, the power supply has failed -
check the power supply.
Green
Green indicates normal operation.
Amber
Amber indicates low power supply.
Red
Red indicates failure.
Fans
The colored border around four stacked fan icons indicate the
operating status of each fan.
Green
Green indicates normal operation.
Amber
Amber indicates low fan speed.
Red
Red indicates failure.
Temperature
Bar
Blue
Indicates the internal temperature of router chassis.The
temperature bar turns yellow when the temperature approaches
the recommended maximum and turns red when the
temperature exceeds the recommended maximum.
System
Green
Indicates that the system is operational.
Summary of Contents for Eclipse 2640 SAN
Page 1: ...Eclipse 2640 SAN Router Administration and Configuration Manual P N 620 00203 020 REV A...
Page 10: ...x Eclipse 2640 SAN Router Administration and Configuration Manual Figures...
Page 18: ...xviii Eclipse 2640 SAN Router Administration and Configuration Manual...
Page 186: ...6 6 38 Eclipse 2640 SAN Router Administration and Configuration Manual Viewing Statistics...
Page 276: ...Eclipse 2640 SAN Router Administration and Configuration Manual i 4 Index...


