


LeveLine
®
Instruction Manual
10401-01026 Rev D
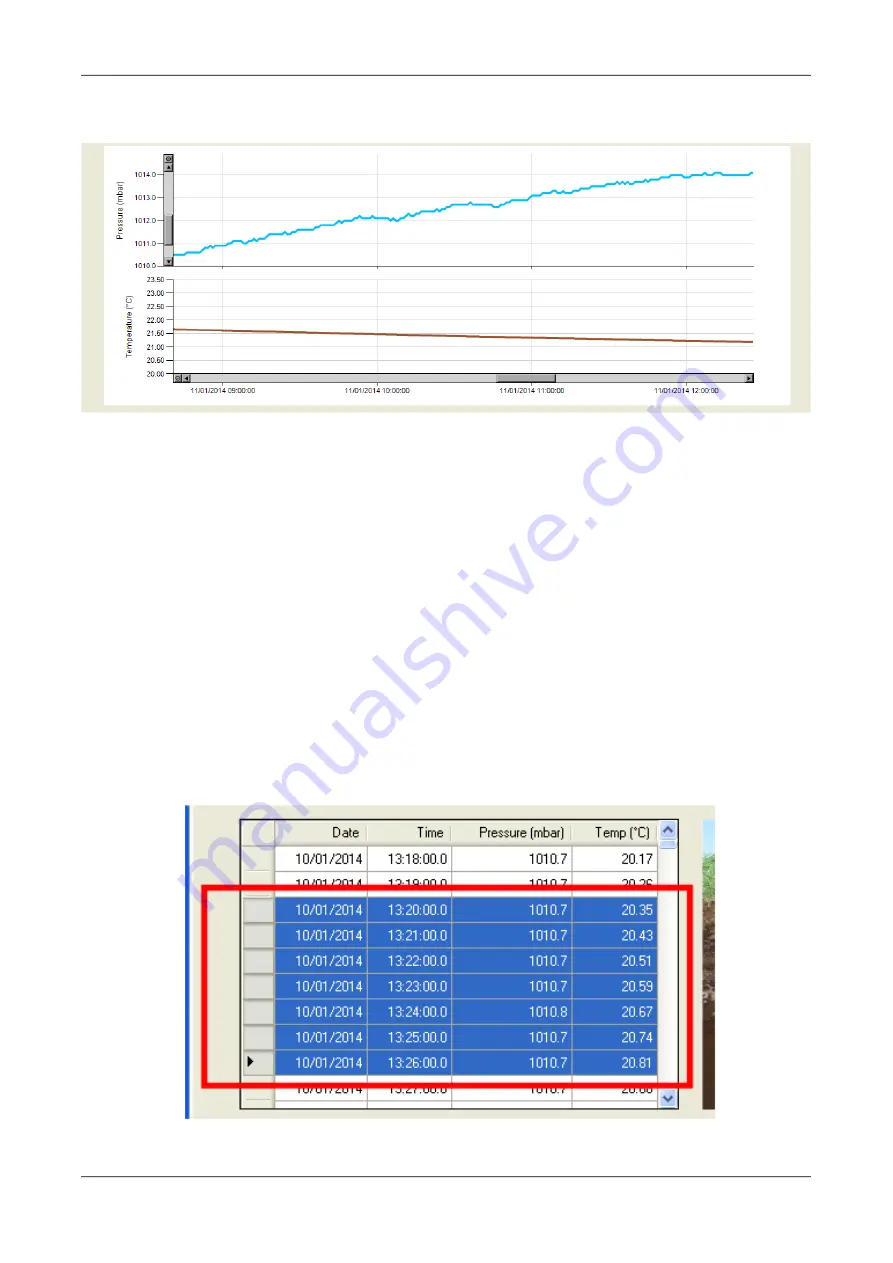
As soon as you release the mouse button, both charts will re-draw displaying just the
selected portion as shown below.
To move around the charts, use the horizontal and/or vertical scroll bars. To zoom back out
on either axis, click the round control at the end of the relevant scroll bar. To export the
charts to a graphics file, click the 'Export Chart to File' button.
2.10.3. Saving Logged Data
There are two options available for saving logged data. You can either save the entire set
of logged data, or you can select sections from the tabulated data to save.
To save the entire data set, click on the 'Save Baro (Level) Data to File' button. You will be
asked for a file name, (which will default to the site ident or probe's serial number) then the
file will be saved with either a .llb (LeveLine
®
Baro) extension or a .llw (LeveLine
®
Water)
extension depending upon which tab you are saving data from.
To save just a portion of the data set, use your mouse in conjunction with your shift and/or
Ctrl keys (in normal Windows fashion) to highlight the desired records in the table as shown
below, then click on the 'Save Baro (Level) Data to File' button. The highlighted section can
be any number of records and need not be contiguous.
© 2019 Aquaread
®
Ltd.
www.aquaread.com
Page 32 of 90


