


Chapter 16
Performing RFoCPRI Testing
JD700B Series User’s Guide
575
3
To change the AxC group and map position settings for the window you have selected, complete
the following steps:
Press
Rx Parameters
.
Press the
AxC Group
soft key.
Enter a value between 1 and 24, and then press the
Enter
soft key.
Press the
Map Position
soft key, and then select the AxC Container number you want to
set from:
AxC 0
,
AxC 1
,
AxC 2
,
AxC 3
,
AxC 4
,
AxC 5
,
AxC 6
, or
AxC 7
.
Enter a value, and then press the
Enter
soft key.
NOTE
The AxC Group and Map Position settings for the top and bottom windows work
independently each other while all other parameter settings change concurrently. If you
have selected one of the NEMs, you cannot change the Map Position setting.
4
To view both traces writing currently in each window together on a single chart with overlapping,
complete the following steps:
To enable the overlaid view, toggle the
Dual Active Trace
to
On
.
Traces from the top and bottom charts appear overlapped on a single chart.
NOTE
As shown in Figure 352, there appears [Top] or [Bottom] at the top left of the chart to
indicate which window is active now. Currently selected active window’s trace is brought
to front in its bold color while the inactive window’s trace sent to back with lighter color.
To change the selection of the active window and trace(s), toggle the
Active Window
soft
key between
Top
and
Bottom
. You can also tap on the upper or lower portion of the chart
on the screen.
To disable the overlap view and return to the dual spectrum view, toggle the
Dual Active
Trace
soft key to
Off
.
5
To clear current (C) and history (H) status of CPRI alarm on LOS and LOF and start a new
monitoring, press the
MEASURE SETUP
hot key and then the
Clear History
soft key.
6
Optional
. Go to
SAVE/LOAD > Save
, and then select a desired save option for your
measurement mode. See “Using save” on page 35 for more information.
If you have saved logging data, you can play them in the Spectrum Replayer mode.
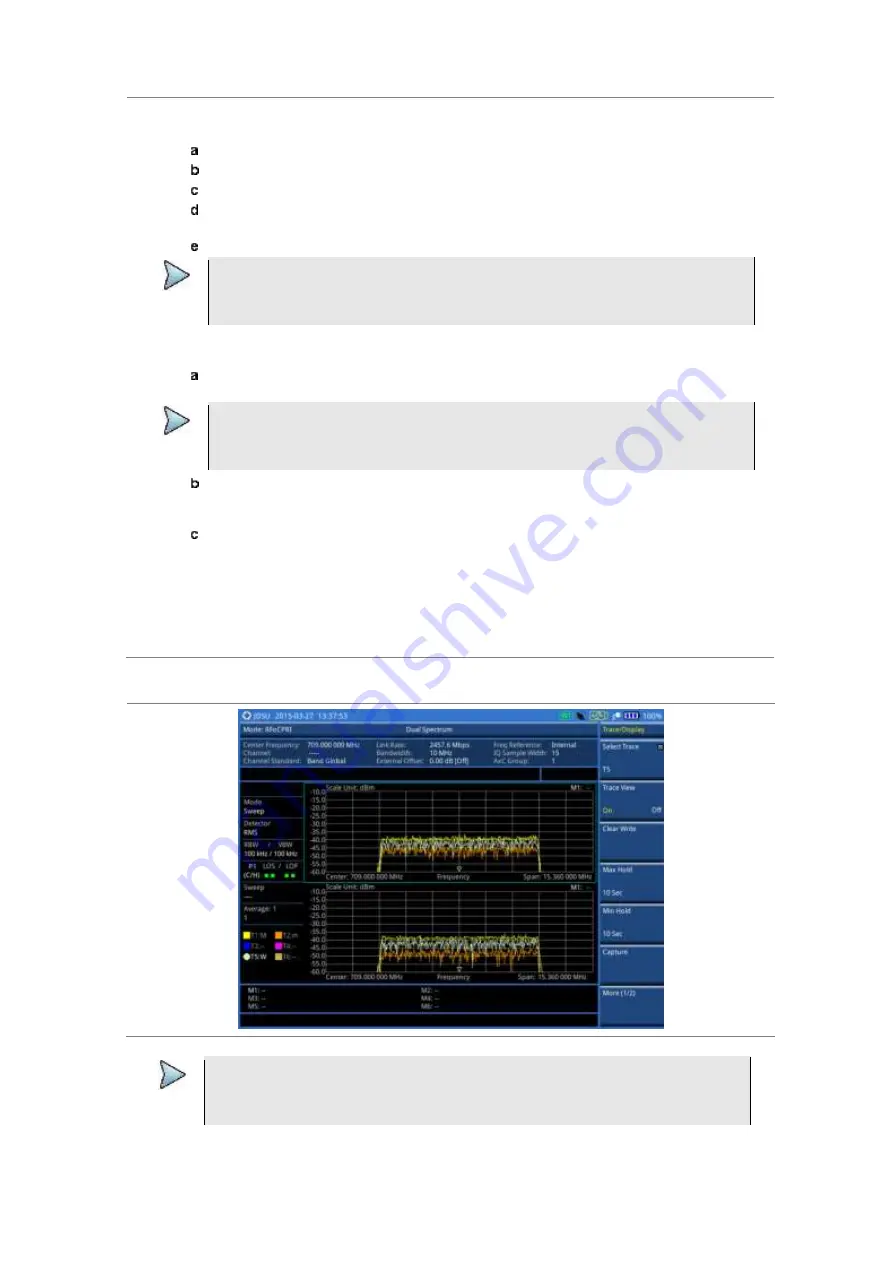
Figure 350 RFoCPRI dual spectrum analysis
NOTE
You can use the
LIMIT
hot key to analyze your measurements with the display line, multi-
segment line, and channel limit. See “Setting limit for interference analysis” on page 585
for more information.
Содержание CellAdvisor JD700B Series
Страница 2: ...CellAdvisorTM JD700B Series FW3 120 User s Guide ...
Страница 105: ...Chapter 4 Using Spectrum Analyzer 104 JD700B Series User s Guide Figure 44 PIM detection for multiple carriers ...
Страница 406: ...Chapter 11 Using EV DO Signal Analyzer JD700B Series User s Guide 405 3 Pilot 4 MAC 64 5 MAC 128 ...
Страница 734: ...Chapter 18 Perfroming BBU Emulation JD700B Series User s Guide 733 Figure 441 Example of verification of link status ...
Страница 763: ...Chapter 21 Performing Fiber Inspection 762 JD700B Series User s Guide Figure 461 Fiber inspection report ...
Страница 808: ...Appendix JD700B Series User s Guide 807 JD740B series ...
Страница 811: ...Appendix 810 JD700B Series User s Guide Figure 470 Append keywords window ...


