


SonTek/YSI Inc
RiverSurveyor System Manual (May 1, 2007)
108
-
Show Discharge CutOff Depth
[enabled] – Show the limit for valid cells defined by the
Discard Data
option in the
Velocity Profile Extrapolation
). The limit is
displayed as a white line that runs along the bottom of the last valid cell in each profile.
This line defines the lower limit of valid data.
-
Show Invalid Depth Data
[enabled] – Display a gray bar at the bottom of any profile that
has invalid depth data.
•
Track Display
– These options relate to the display of the
(§
-
Enable Automatic Grid Spacing
[enabled] – When in Bottom-Track mode, the Track win-
dow will automatically scale the grid to the current zoom level. If this option is disabled,
grid spacing will be defined by the value entered using the
Modify Grid Spacing
button.
-
Show Shallow Water Measurement
[enabled] – Display the shallow water velocity meas-
urement (if present).
-
Draw connection between Waypoints
[enabled] – Draw a line between each of the way-
points representing the navigational route. See for §
waypoint details.
•
Discharge Format
– Enter the number of digits that will be used for the display of all dis-
charge values (Data Display and Measurement Summary). The default is five digits.
•
Data Warning Thresholds
– Allows you to set
Warning
and
Alert
threshold values for the
(§
)
parameters. Selected
identify threshold levels.
- Values less than the
Warning
value are displayed in the
Good Data
color.
- Values between the
Warning
and
Alert
values are displayed in the
Warning Data
color.
- Values greater than the
Alert
value are displayed in the
Alert Data
color.
•
Choose
Metric Units
(meters, m/s, °C) or
English Units
(feet, ft/s, °F) to select the scaling in
displays and exported files. The setting immediately affects all open data files.
•
Save Files to Path
– Enter the path to the folder in which you want to store all data files that
are output from
RiverSurveyor
. Default is
c:\SonData
. We recommend using an applica-
tion-specific path such as
c:\SonData\RiverSurveyor\Colorado River\2003-03-05
.
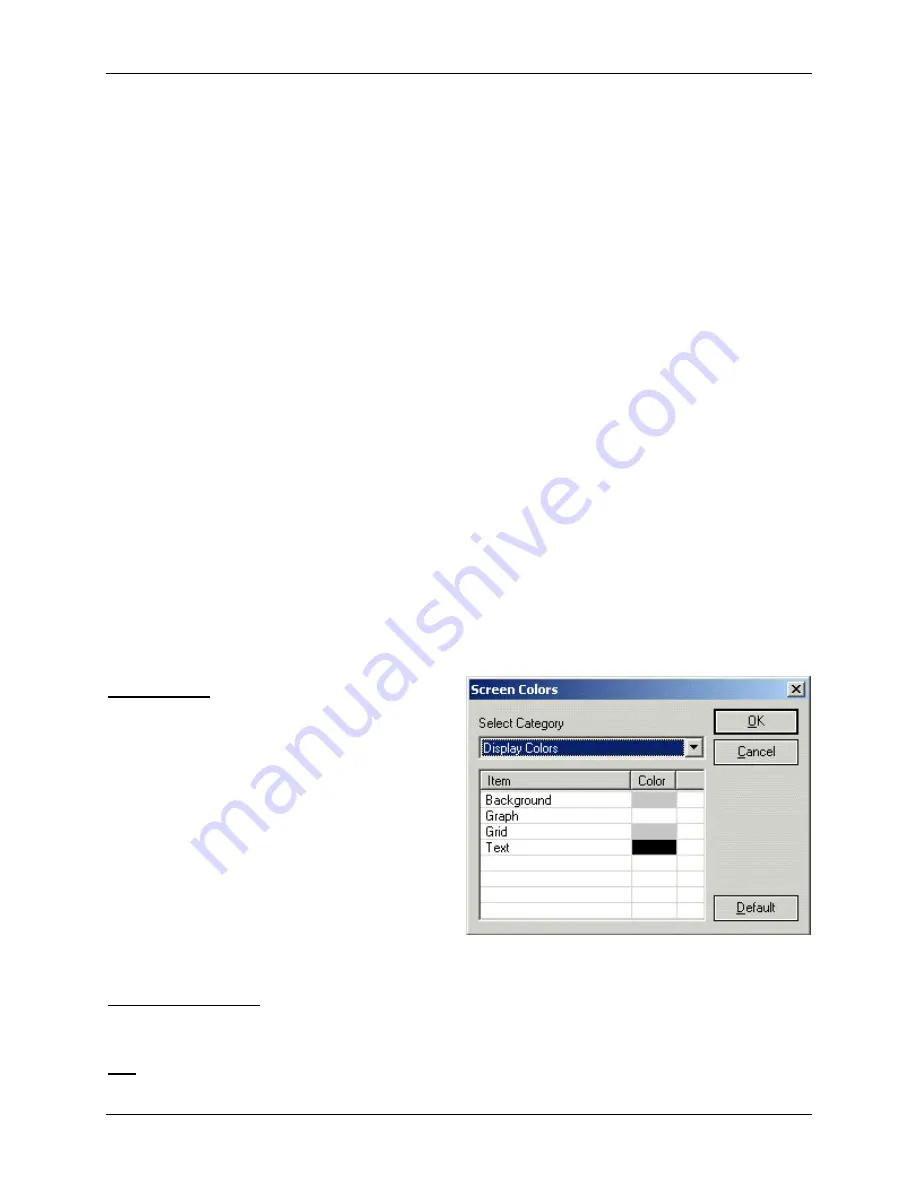
Screen Colors
The colors used in the screen displays can be
changed using the
Screen Colors
dialog box
(
). Click the
Item
label to change the
Color
of the selected display item. Use Select
Category to choose the display area you wish to
modify. Options include:
•
Display Colors
– General color scheme used
for all graphs and axes.
•
Track Window Colors
–
(§
) items (boat and boat track).
•
Data Display Colors
– Data display captions,
text, and background.
•
Data Quality Colors
–
settings for
DQI
and
Boat/Water Speed
variable.
1, 2, 3, 4 (recent files)
Lists the last four ADP data files (
.adp
) that were accessed. Selecting one of these items opens
the associated file.
Exit
Closes all open ADP data files (
.adp
), and then exits the
RiverSurveyor
program.
Figure 7-19.
Screen Colors
dialog box
Summary of Contents for SonTek RiverSurveyor
Page 2: ...SonTek YSI Inc RiverSurveyor System Manual May 1 2007 ii ...
Page 4: ...SonTek YSI Inc RiverSurveyor System Manual May 1 2007 iv ...
Page 14: ......
Page 24: ...SonTek YSI Inc RiverSurveyor System Manual May 1 2007 12 ...
Page 26: ...SonTek YSI Inc RiverSurveyor System Manual May 1 2007 14 ...
Page 74: ...SonTek YSI Inc RiverSurveyor System Manual May 1 2007 62 ...
Page 82: ...SonTek YSI Inc RiverSurveyor System Manual May 1 2007 70 ...
Page 148: ...SonTek YSI Inc RiverSurveyor System Manual May 1 2007 136 ...
Page 162: ...SonTek YSI Inc RiverSurveyor System Manual May 1 2007 150 ...
Page 166: ...SonTek YSI Inc RiverSurveyor System Manual May 1 2007 154 ...
Page 168: ...SonTek YSI Inc RiverSurveyor System Manual May 1 2007 156 ...
Page 182: ...SonTek YSI Inc RiverSurveyor System Manual May 1 2007 170 ...
Page 194: ...SonTek YSI Inc RiverSurveyor System Manual May 1 2007 182 ...


