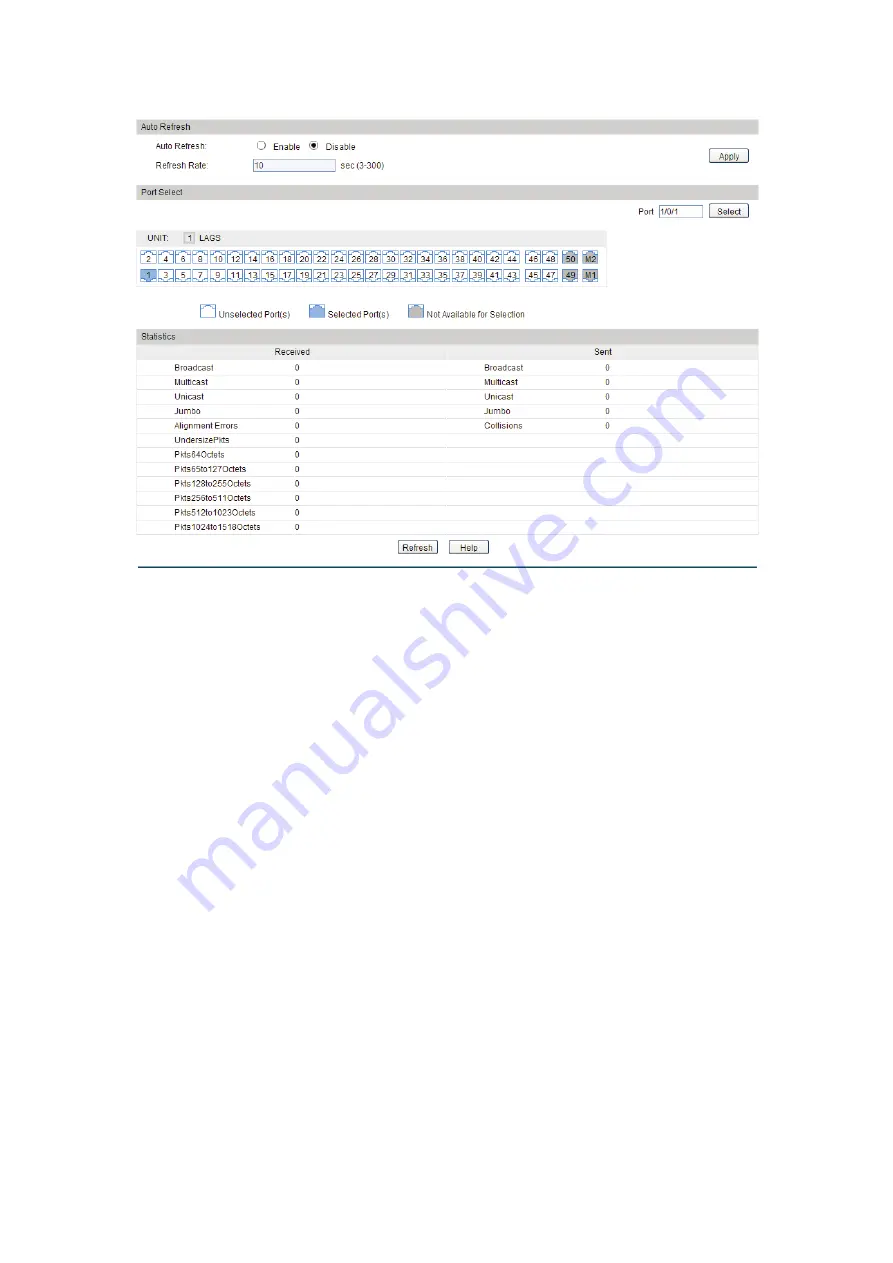
Choose the menu
Switching
→
Traffic Monitor
→Traffic Statistics
to load the following page.
Figure 6-12 Traffic Statistics
Configuration Procedure:
1)
To get the real-time traffic summary, enable auto refresh in the
Auto Refresh
section, or
click
Refresh
at the bottom of the page.
2)
In the
Traffic Summary
section, click
1
to show the information of the physical ports, and
click
LAGS
to show the information of the LAGs.
Entry Description:
Auto Refresh
Auto Refresh:
Allows you to Enable/Disable refreshing the Traffic Summary
automatically.
Refresh Rate:
Enter a value in seconds to specify the refresh interval.
Statistics
Received:
Displays the details of the packets received on the port.
Sent:
Displays the details of the packets transmitted on the port.
Broadcast:
Displays the number of good broadcast packets received or
sent on the port. Error frames are not counted in.
Multicast:
Displays the number of good multicast packets received or
sent on the port. Error frames are not counted in.
70


